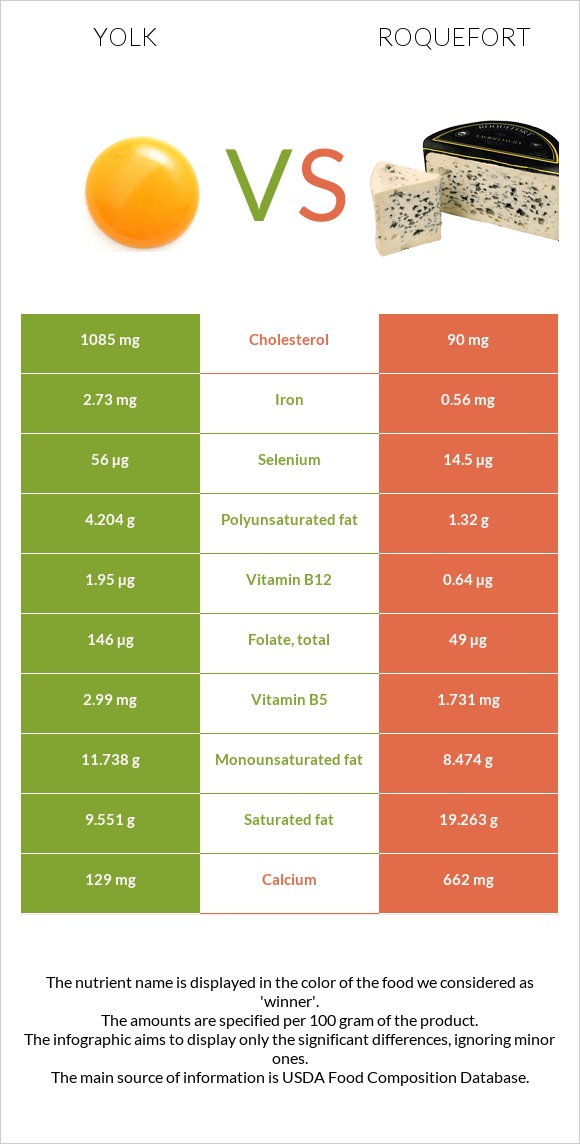
The main differences between yolk and roquefort Yolk is richer in selenium, vitamin B12, iron, vitamin B5, folate, and vitamin B6, yet roquefort is richer in calcium. Daily need coverage for cholesterol for yolk is 332% higher. Yolk contains 5 times more iron than roquefort. Yolk contains 2.73mg of iron, while roquefort contains 0.56mg. Roquefort contains less cholesterol. Yolk has a lower glycemic index than roquefort. Food types used in this article are Egg, yolk, raw, fresh and Cheese, roquefort .
Infographic
Mineral Comparison
Mineral comparison score is based on the number of minerals by which one or the other food is richer. The "coverage" charts below show how much of the daily needs can be covered by 300 grams of the food.
6
100 g
300 g
1 large - 17g 1 cup - 243g
Magnesium
Magnesium
Calcium
Calcium
Potassium
Potassium
Iron
Iron
Copper
Copper
Zinc
Zinc
Phosphorus
Phosphorus
Sodium
Sodium
Manganese
Manganese
Selenium
Selenium
3.6%
39%
9.6%
102%
26%
63%
167%
6.3%
7.2%
305%
2
100 g
300 g
1 oz - 28.35g 1 package (3 oz) - 85g
Magnesium
Magnesium
Calcium
Calcium
Potassium
Potassium
Iron
Iron
Copper
Copper
Zinc
Zinc
Phosphorus
Phosphorus
Sodium
Sodium
Manganese
Manganese
Selenium
Selenium
21%
199%
8%
21%
11%
57%
168%
236%
3.9%
79%
Vitamin Comparison
Vitamin comparison score is based on the number of vitamins by which one or the other food is richer. The "coverage" charts below show how much of the daily needs can be covered by 300 grams of the food.
9
100 g
300 g
1 large - 17g 1 cup - 243g
Vitamin C
Vit. C
Vitamin D
Vit. D
Vitamin A
Vit. A
Vitamin E
Vit. E
Vitamin B1
Vit. B1
Vitamin B2
Vit. B2
Vitamin B3
Vit. B3
Vitamin B5
Vit. B5
Vitamin B6
Vit. B6
Vitamin B12
Vit. B12
Vitamin K
Vit. K
Folate
Folate
0%
81%
127%
52%
44%
122%
0.45%
179%
81%
244%
1.8%
110%
2
100 g
300 g
1 oz - 28.35g 1 package (3 oz) - 85g
Vitamin C
Vit. C
Vitamin D
Vit. D
Vitamin A
Vit. A
Vitamin E
Vit. E
Vitamin B1
Vit. B1
Vitamin B2
Vit. B2
Vitamin B3
Vit. B3
Vitamin B5
Vit. B5
Vitamin B6
Vit. B6
Vitamin B12
Vit. B12
Vitamin K
Vit. K
Folate
Folate
0%
0%
98%
0%
10%
135%
14%
104%
29%
80%
0%
37%
All nutrients comparison - raw data values
Nutrient
DV% diff.
Cholesterol
1085mg
90mg
332%
Choline
820.2mg
149%
Sodium
48mg
1809mg
77%
Selenium
56µg
14.5µg
75%
Vitamin B12
1.95µg
0.64µg
55%
Calcium
129mg
662mg
53%
Saturated fat
9.551g
19.263g
44%
Vitamin D*
218 IU
27%
Vitamin D
5.4µg
27%
Iron
2.73mg
0.56mg
27%
Vitamin B5
2.99mg
1.731mg
25%
Folate
146µg
49µg
24%
Polyunsaturated fat
4.204g
1.32g
19%
Vitamin E
2.58mg
17%
Vitamin B6
0.35mg
0.124mg
17%
Protein
15.86g
21.54g
11%
Vitamin B1
0.176mg
0.04mg
11%
Vitamin A
381µg
294µg
10%
Monounsaturated fat
11.738g
8.474g
8%
Fats
26.54g
30.64g
6%
Magnesium
5mg
30mg
6%
Copper
0.077mg
0.034mg
5%
Vitamin B2
0.528mg
0.586mg
4%
Vitamin B3
0.024mg
0.734mg
4%
Calories
322kcal
369kcal
2%
Zinc
2.3mg
2.08mg
2%
Carbs
3.59g
2g
1%
Potassium
109mg
91mg
1%
Manganese
0.055mg
0.03mg
1%
Vitamin K
0.7µg
1%
Protein per 100 calories
4.9g
5.8g
N/A
Calories per 10 g protein
203kcal
171kcal
N/A
Weight per 100 calories
31g
27g
N/A
Unsaturated / Saturated Fat ratio
1.7
0.51
N/A
Net carbs
3.59g
2g
N/A
Sugar
0.56g
N/A
Phosphorus
390mg
392mg
0%
Tryptophan
0.177mg
0.303mg
0%
Threonine
0.687mg
0.965mg
0%
Isoleucine
0.866mg
1.217mg
0%
Leucine
1.399mg
2.114mg
0%
Lysine
1.217mg
1.848mg
0%
Methionine
0.378mg
0.558mg
0%
Phenylalanine
0.681mg
1.023mg
0%
Valine
0.949mg
1.614mg
0%
Histidine
0.416mg
0.602mg
0%
Fructose
0.07g
0%
Omega-3 - EPA
0.011g
N/A
Omega-3 - DHA
0.114g
N/A
Macronutrient Comparison
Macronutrient breakdown side-by-side comparison
2
16%
27%
4%
52%
2%
Protein:
15.86 g
Fats:
26.54 g
Carbs:
3.59 g
Water:
52.31 g
Other:
1.7 g
3
22%
31%
2%
39%
6%
Protein:
21.54 g
Fats:
30.64 g
Carbs:
2 g
Water:
39.38 g
Other:
6.44 g
Contains
more
Carbs Carbs
+79.5%
Contains
more
Water Water
+32.8%
Contains
more
Protein Protein
+35.8%
Contains
more
Fats Fats
+15.4%
Contains
more
Other Other
+278.8%
Fat Type Comparison
Fat type breakdown side-by-side comparison
3
37%
46%
16%
Saturated fat:
Sat. Fat
9.551 g
Monounsaturated fat:
Mono. Fat
11.738 g
Polyunsaturated fat:
Poly. Fat
4.204 g
0
66%
29%
5%
Saturated fat:
Sat. Fat
19.263 g
Monounsaturated fat:
Mono. Fat
8.474 g
Polyunsaturated fat:
Poly. Fat
1.32 g
Contains
less
Sat. Fat Saturated fat
-50.4%
Contains
more
Mono. Fat Monounsaturated fat
+38.5%
Contains
more
Poly. Fat Polyunsaturated fat
+218.5%