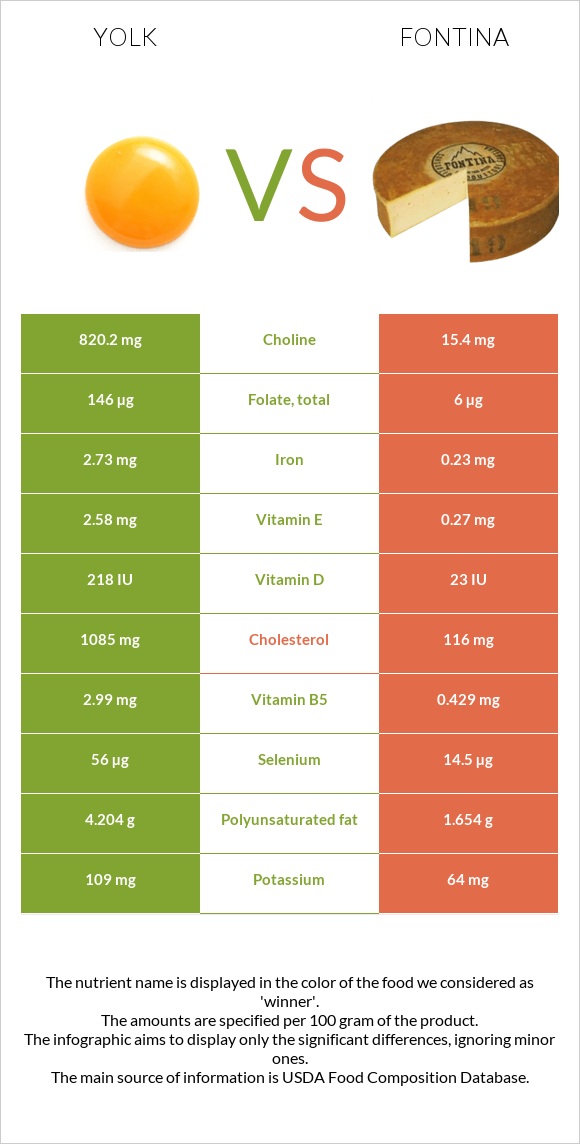
A recap on the differences between yolk and fontina Yolk has more choline, selenium, vitamin B5, folate, iron, and vitamin B2; however, fontina is higher in calcium. Yolk covers your daily cholesterol needs 323% more than fontina. Fontina contains 53 times less choline than yolk. Yolk contains 820.2mg of choline, while fontina contains 15.4mg. Fontina has less cholesterol. The glycemic index of fontina is higher. Food varieties used in this article are Egg, yolk, raw, fresh and Cheese, fontina .
Infographic
Mineral Comparison
Mineral comparison score is based on the number of minerals by which one or the other food is richer. The "coverage" charts below show how much of the daily needs can be covered by 300 grams of the food.
7
100 g
300 g
1 large - 17g 1 cup - 243g
Magnesium
Magnesium
Calcium
Calcium
Potassium
Potassium
Iron
Iron
Copper
Copper
Zinc
Zinc
Phosphorus
Phosphorus
Sodium
Sodium
Manganese
Manganese
Selenium
Selenium
3.6%
39%
9.6%
102%
26%
63%
167%
6.3%
7.2%
305%
3
100 g
300 g
1 cubic inch - 15g 1 slice (1 oz) - 28g 1 oz - 28.35g 1 cup, shredded - 108g 1 cup, diced - 132g 1 package (8 oz) - 227g
Magnesium
Magnesium
Calcium
Calcium
Potassium
Potassium
Iron
Iron
Copper
Copper
Zinc
Zinc
Phosphorus
Phosphorus
Sodium
Sodium
Manganese
Manganese
Selenium
Selenium
10%
165%
5.6%
8.6%
8.3%
95%
148%
104%
1.8%
79%
Vitamin Comparison
Vitamin comparison score is based on the number of vitamins by which one or the other food is richer. The "coverage" charts below show how much of the daily needs can be covered by 300 grams of the food.
9
100 g
300 g
1 large - 17g 1 cup - 243g
Vitamin C
Vit. C
Vitamin D
Vit. D
Vitamin A
Vit. A
Vitamin E
Vit. E
Vitamin B1
Vit. B1
Vitamin B2
Vit. B2
Vitamin B3
Vit. B3
Vitamin B5
Vit. B5
Vitamin B6
Vit. B6
Vitamin B12
Vit. B12
Vitamin K
Vit. K
Folate
Folate
0%
81%
127%
52%
44%
122%
0.45%
179%
81%
244%
1.8%
110%
2
100 g
300 g
1 cubic inch - 15g 1 slice (1 oz) - 28g 1 oz - 28.35g 1 cup, shredded - 108g 1 cup, diced - 132g 1 package (8 oz) - 227g
Vitamin C
Vit. C
Vitamin D
Vit. D
Vitamin A
Vit. A
Vitamin E
Vit. E
Vitamin B1
Vit. B1
Vitamin B2
Vit. B2
Vitamin B3
Vit. B3
Vitamin B5
Vit. B5
Vitamin B6
Vit. B6
Vitamin B12
Vit. B12
Vitamin K
Vit. K
Folate
Folate
0%
9%
87%
5.4%
5.3%
47%
2.8%
26%
19%
210%
6.5%
4.5%
All nutrients comparison - raw data values
Nutrient
DV% diff.
Cholesterol
1085mg
116mg
323%
Choline
820.2mg
15.4mg
146%
Selenium
56µg
14.5µg
75%
Vitamin B5
2.99mg
0.429mg
51%
Saturated fat
9.551g
19.196g
44%
Calcium
129mg
550mg
42%
Folate
146µg
6µg
35%
Sodium
48mg
800mg
33%
Iron
2.73mg
0.23mg
31%
Vitamin B2
0.528mg
0.204mg
25%
Vitamin D*
218 IU
23 IU
24%
Vitamin D
5.4µg
0.6µg
24%
Vitamin B6
0.35mg
0.083mg
21%
Protein
15.86g
25.6g
19%
Polyunsaturated fat
4.204g
1.654g
17%
Vitamin E
2.58mg
0.27mg
15%
Vitamin A
381µg
261µg
13%
Vitamin B1
0.176mg
0.021mg
13%
Zinc
2.3mg
3.5mg
11%
Vitamin B12
1.95µg
1.68µg
11%
Monounsaturated fat
11.738g
8.687g
8%
Fats
26.54g
31.14g
7%
Copper
0.077mg
0.025mg
6%
Phosphorus
390mg
346mg
6%
Calories
322kcal
389kcal
3%
Magnesium
5mg
14mg
2%
Manganese
0.055mg
0.014mg
2%
Vitamin K
0.7µg
2.6µg
2%
Carbs
3.59g
1.55g
1%
Potassium
109mg
64mg
1%
Vitamin B3
0.024mg
0.15mg
1%
Protein per 100 calories
4.9g
6.6g
N/A
Calories per 10 g protein
203kcal
152kcal
N/A
Weight per 100 calories
31g
26g
N/A
Unsaturated / Saturated Fat ratio
1.7
0.54
N/A
Net carbs
3.59g
1.55g
N/A
Sugar
0.56g
1.55g
N/A
Tryptophan
0.177mg
0.361mg
0%
Threonine
0.687mg
0.935mg
0%
Isoleucine
0.866mg
1.384mg
0%
Leucine
1.399mg
2.664mg
0%
Lysine
1.217mg
2.328mg
0%
Methionine
0.378mg
0.706mg
0%
Phenylalanine
0.681mg
1.497mg
0%
Valine
0.949mg
1.926mg
0%
Histidine
0.416mg
0.959mg
0%
Fructose
0.07g
0%
Omega-3 - EPA
0.011g
0g
N/A
Omega-3 - DHA
0.114g
0g
N/A
Macronutrient Comparison
Macronutrient breakdown side-by-side comparison
2
16%
27%
4%
52%
2%
Protein:
15.86 g
Fats:
26.54 g
Carbs:
3.59 g
Water:
52.31 g
Other:
1.7 g
3
26%
31%
38%
4%
Protein:
25.6 g
Fats:
31.14 g
Carbs:
1.55 g
Water:
37.92 g
Other:
3.79 g
Contains
more
Carbs Carbs
+131.6%
Contains
more
Water Water
+37.9%
Contains
more
Protein Protein
+61.4%
Contains
more
Fats Fats
+17.3%
Contains
more
Other Other
+122.9%
Fat Type Comparison
Fat type breakdown side-by-side comparison
3
37%
46%
16%
Saturated fat:
Sat. Fat
9.551 g
Monounsaturated fat:
Mono. Fat
11.738 g
Polyunsaturated fat:
Poly. Fat
4.204 g
0
65%
29%
6%
Saturated fat:
Sat. Fat
19.196 g
Monounsaturated fat:
Mono. Fat
8.687 g
Polyunsaturated fat:
Poly. Fat
1.654 g
Contains
less
Sat. Fat Saturated fat
-50.2%
Contains
more
Mono. Fat Monounsaturated fat
+35.1%
Contains
more
Poly. Fat Polyunsaturated fat
+154.2%