Pork vs. Chicken — Health Impact and Nutrition Comparison


Summary
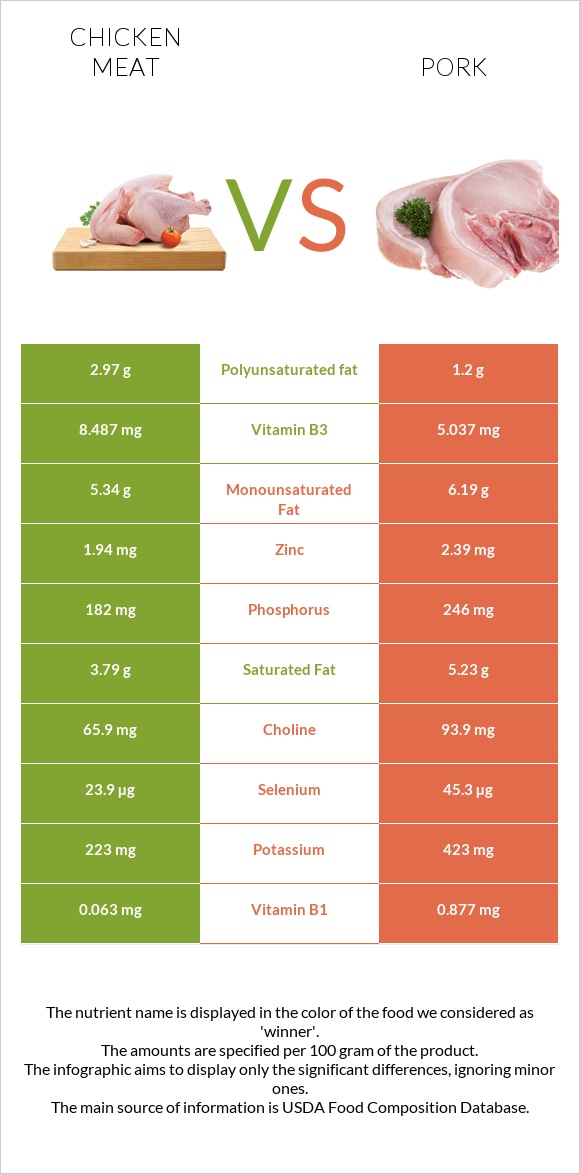
Pork and chicken have similar macronutrient compositions; however, pork is slightly higher in calories, protein, and fats. Pork is also overall richer in vitamins and minerals, containing larger amounts of vitamin C, vitamin D, vitamins B1, B2, and B12, calcium potassium, phosphorus, and zinc. On the other hand, chicken is richer in vitamin A, vitamin K, vitamins B3 and B5, and iron.
Even though pork may be nutritionally superior, pork is red meat, while chicken meat is white. Due to this, pork tends to have a bigger negative impact on health compared to chicken.
Table of contents
Introduction
Pork and chicken are two of the most commonly consumed meats in the world. The choice of pork or chicken often comes up when ordering a meal or planning dinner. In this article, we will talk about what sets these meats apart and what they have in common, with the main focus on health and nutrition.
Classification
Pork is classified as red meat due to its high content of myoglobin. Chicken, on the other hand, is poultry and is classified as white meat.
According to the USDA, chickens can be classified into four groups: Cornish game hen, broiler-fryer, roaster, and capon (1). The two main differentiating factors between these groups are the chicken’s age and weight.
Appearance
Based on the classification, one of the defining differences between these meats becomes apparent. Chicken meat is usually light pink, while pork is darker in color.
Pork meat has recognizable marbling: visible white wavy lines of intramuscular fat. Chicken meat sometimes also has intramuscular fat called white striping; however, it is less apparent and less common.
Taste and Use
The taste of pork can differ based on its cut. In general, it is described to be fatty and salty. Chicken is described as having a more tender and soft texture.
Chicken and pork can be used in similar ways in the kitchen. Both of these meats can be grilled, broiled, baked, braised, and much more.
Bans and Religion
While chicken consumption is not prohibited by any major religious laws, pork intake is different.
According to orthodox Jewish dietary laws, pork meat is not a kosher food, meaning its consumption is forbidden. Similarly, it is also prohibited by Islamic dietary laws.
Types of Meat
Both pork and chicken meat can be produced as processed or fresh meat. Processed meat is defined as meat preserved by smoking, curing, salting, or adding chemical preservatives (2).
Based on the cut of pork, there are different varieties of this meat. The four primal cuts of pork are the shoulder (the butt and the picnic), the leg or ham, the loin, and the belly or side.
Chicken meat is mainly divided into three parts: the breast, the leg, and the wing. Breast meat is the most commonly used part of the chicken, and it is also the lightest in color.
Based on the cut and production method, each type of meat has slightly varying nutritional and biological properties.
Nutrition
For this article, we are looking at the nutritional values of a whole, broiled pork loin and roasted broiler-fryer chicken with skin.
Macronutrients and Calories
Pork and chicken have very similar macronutrient compositions. However, pork is a little denser in nutrients containing 58% water, while chicken consists of 60% water.
One average serving size of pork weighs 85g. Chicken’s serving size is much larger - 140g or one cup of diced chicken.
Calories
Chicken and pork are both high-calorie foods, containing nearly the same amount of calories. A hundred-gram serving of pork contains 242 calories, while chicken has 239.
Protein and Fats
Pork and chicken are similar in these macronutrients as well.
Both of these meats contain 27g of protein per 100g serving. Both are also very rich in all essential amino acids. Pork contains slightly higher levels of all those amino acids except for isoleucine and methionine.
Pork is slightly higher in fats. However, chicken contains larger amounts of polyunsaturated fatty acids, while pork is richer in monounsaturated and saturated fats.
Pork is lower in cholesterol.
Carbohydrates
Like most meats, both chicken and pork contain no notable amount of carbohydrates.
Vitamins
Overall, pork is a little richer in vitamins, containing more of vitamin B1, vitamin B12, vitamins B2 and B6, and vitamin E. Pork also contains vitamin C and vitamin D, which chicken lacks entirely.
On the other hand, chicken is richer in vitamin A, vitamin B3, and vitamin B5. One vitamin found in chicken that pork completely lacks is vitamin K.
Pork and chicken contain the same amount of folate form of vitamin B9.
Vitamin Comparison
Contains
more
Vitamin AVitamin A
+2200%
Contains
more
Vitamin B3Vitamin B3
+68.5%
Contains
more
Vitamin B5Vitamin B5
+47.6%
Contains
more
Vitamin KVitamin K
+∞%
Contains
more
Vitamin CVitamin C
+∞%
Contains
more
Vitamin DVitamin D
+∞%
Contains
more
Vitamin B1Vitamin B1
+1292.1%
Contains
more
Vitamin B2Vitamin B2
+91.1%
Contains
more
Vitamin B6Vitamin B6
+16%
Contains
more
Vitamin B12Vitamin B12
+133.3%
Contains
more
CholineCholine
+42.5%
Minerals
Pork is the clear winner in this category, being higher in potassium, phosphorus, calcium, zinc, magnesium, selenium, copper, and choline. Pork also contains less sodium.
However, chicken is richer in iron and manganese.
Mineral Comparison
Contains
more
IronIron
+44.8%
Contains
more
ManganeseManganese
+122.2%
Contains
more
MagnesiumMagnesium
+21.7%
Contains
more
CalciumCalcium
+26.7%
Contains
more
PotassiumPotassium
+89.7%
Contains
more
CopperCopper
+10.6%
Contains
more
ZincZinc
+23.2%
Contains
more
PhosphorusPhosphorus
+35.2%
Contains
less
SodiumSodium
-24.4%
Contains
more
SeleniumSelenium
+89.5%
Glycemic Index
Based on the fact that pork and chicken contain almost no carbohydrates, the glycemic index of these foods is considered to be 0. Check the GI chart for more information about the glycemic index of other foods.
Acidity
The standard pH value for fresh chicken meat falls in the range of 5.3 to 6.5, making chicken a slightly acidic food (3).
Regular pork also has an acidic pH value of 5.6 to 5.7. Pork meat with a higher pH value may be dark, firm, and dry (4).
Another way of evaluating the acidity of foods is the potential renal acid load or PRAL. The PRAL values demonstrate how much acid or base the food produces inside the organism.
The PRAL values for pork and chicken are 12.6 and 14.6, respectively. The higher this number, the more acidic the food is.
Weight Loss & Diets
Chicken and pork are both high-calorie foods; however, pork has slightly higher calories.
These meats fit well in both low-carb and low-glycemic index diets as they contain no carbohydrates.
Despite the high-calorie count, pork and chicken may have potential use in weight loss diets, as the high protein and fat content leads to high satiety and energy expenditure.
There is some evidence, however, limited, showing pork intake to have a positive impact on waist circumference (5).
Regular consumption of lean fresh pork has also been studied to reduce weight relatively, body mass index, waist circumference, percentage of body fat, fat mass, and abdominal fat (6).
Among children, higher meat consumption, including pork and chicken, has been associated with lower levels of body mass index, as well as systolic and diastolic blood pressure (7).
Poultry meat intake, along with vegetables, has been correlated with a reduced risk of developing obesity and obesity-related diseases (8).
While fresh pork and chicken may have beneficial effects as part of a balanced diet, processed meats can have a negative impact on metabolism (5).
Health Benefits
Opinions about the health benefits of meat consumption are often contrary. In this section, we will look into scientifically founded information about the health impact of chicken and pork intake.
Cardiovascular Health
Regular intake of fresh lean pork can improve body composition without negatively affecting risk factors for cardiometabolic disease (6).
Poultry, such as chicken, may not have a beneficial effect on cardiovascular health. Still, the National Heart Foundation of Australia concluded that there is not enough strong evidence to recommend a limit on the intake level (9).
Diabetes
Substitution of red meat with poultry, such as chicken, decreases the risk of developing type 2 and gestational diabetes, also improving glycemic control and cardiovascular risk factors (10).
The limited evidence about pork intake and diabetes has suggested a possible negative impact of processed pork on glucose and insulin metabolism and a possible positive impact of pork intake on waist circumference and high-density cholesterol, also known as “good” cholesterol (5).
Chicken may serve as a source of protein for patients with type 2 diabetes and renal dysfunction (11).
Cancer
In one study, increased white meat intake and equally decreased red meat intake has been correlated with a significantly reduced risk of cancer of the esophagus, liver, colon, rectum, anus, lung, and pleura. This inverse association may be largely due to the substitution of red meat (12).
Downsides and Risks
Overall, various studies have demonstrated red and processed meat intake to be correlated with an increased risk of type 2 diabetes, cardiovascular disease, cancer, and all-cause mortality (13).
Cardiovascular Health
Substituting red meats with high-quality plant foods, such as legumes, nuts, or soy, as well as whole grains or dairy, might potentially reduce the risk of coronary heart disease (14).
Red meat intake has been studied to increase low-density lipoprotein levels, also known as “bad” cholesterol, in the blood (2).
The dietary heme iron found in red meat has also been associated with cardiovascular diseases, such as myocardial infarction and fatal coronary heart disease, potentially due to the additional oxidative stress (14).
A study has concluded that a higher intake of processed meat, unprocessed red meat, and poultry is significantly associated with a small increased risk of cardiovascular diseases. Higher consumption of processed meat, unprocessed red meat, but not poultry is associated with an increased risk of all-cause mortality (15).
Diabetes
A study has found red meat, but not poultry, intake to be positively associated with increased diabetes risk (16).
In contrast to the previous statement, another research has concluded that both red meat and poultry consumption were associated with an increased risk of type 2 diabetes (17)
The cooking method also plays a role in the increased risk of diabetes due to meat consumption. High-heat cooking of meats, such as grilling and barbecuing, has a bigger negative impact on health when compared to moderate-temperature cooking, such as stir-frying, boiling, steaming, or sauteing (18).
Cancer
Both red and processed meat has been studied to have undesirable effects relating to oncological conditions. Red meat consumption has been associated with an increased risk of colorectal, nasopharyngeal, lung, and pancreas, as well as breast and prostate cancer (18, 19). In addition to those, processed meat might also increase the risk of esophageal (squamous cell carcinoma) and stomach cancer (non-cardia) (18).
There are potential positive associations between poultry intake and the risk of prostate cancer and non-Hodgkin lymphoma (19).
References
- Poultry Classifications Get a 21st Century Upgrade
- https://www.ahajournals.org/doi/10.1161/CIRCULATIONAHA.118.035225
- https://iopscience.iop.org/article/10.1088/1755-1315/102/1/012051/pdf
- http://www.omafra.gov.on.ca/english/livestock/swine/facts/info_qs_meatph.htm
- https://www.ncbi.nlm.nih.gov/pmc/articles/PMC3792009/
- https://www.ncbi.nlm.nih.gov/pmc/articles/PMC3407990/
- https://nutritionj.biomedcentral.com/articles/10.1186/s12937-017-0252-7
- https://www.researchgate.net/publication/322959346
- Animal sourced protein (meat and poultry) and heart health
- https://www.researchgate.net/publication/322959346
- https://pubmed.ncbi.nlm.nih.gov/11919119/
- https://care.diabetesjournals.org/content/43/2/265
- https://www.bmj.com/content/371/bmj.m4141
- https://jamanetwork.com/journals/jamainternalmedicine/fullarticle/2759737
- https://link.springer.com/article/10.1007/s00125-020-05091-x
- https://academic.oup.com/aje/article/186/7/824/3848997
- How Meat Is Cooked May Affect Risk of Type 2 Diabetes
- https://www.wcrf.org/dietandcancer/exposures/meat-fish-dairy
- https://jech.bmj.com/content/73/Suppl_1/A15.1

Infographic
Macronutrient Comparison
Fat Type Comparison
| Contains less Sat. FatSaturated Fat | -27.5% |
| Contains more Poly. FatPolyunsaturated fat | +147.5% |
| Contains more Mono. FatMonounsaturated Fat | +15.9% |
Comparison summary table
|
|
||
| Lower in Cholesterol |
|
||
| Lower in Sodium |
|
||
| Lower in price |
|
||
| Rich in minerals |
|
||
| Rich in vitamins |
|
||
| Lower in Saturated Fat |
|
||
| Lower in Sugar | Equal | ||
| Lower in Glycemic Index | Equal | ||
All nutrients comparison - raw data values
| Nutrient | |
|
Opinion |
| Calories | 239kcal | 242kcal |
|
| Protein | 27.3g | 27.32g |
|
| Fats | 13.6g | 13.92g |
|
| Vitamin C | 0mg | 0.6mg |
|
| Cholesterol | 88mg | 80mg |
|
| Vitamin D | 2IU | 53IU |
|
| Magnesium | 23mg | 28mg |
|
| Calcium | 15mg | 19mg |
|
| Potassium | 223mg | 423mg |
|
| Iron | 1.26mg | 0.87mg |
|
| Copper | 0.066mg | 0.073mg |
|
| Zinc | 1.94mg | 2.39mg |
|
| Phosphorus | 182mg | 246mg |
|
| Sodium | 82mg | 62mg |
|
| Vitamin A | 161IU | 7IU |
|
| Vitamin A | 48µg | 2µg |
|
| Vitamin E | 0.27mg | 0.29mg |
|
| Vitamin D | 0µg | 1.3µg |
|
| Manganese | 0.02mg | 0.009mg |
|
| Selenium | 23.9µg | 45.3µg |
|
| Vitamin B1 | 0.063mg | 0.877mg |
|
| Vitamin B2 | 0.168mg | 0.321mg |
|
| Vitamin B3 | 8.487mg | 5.037mg |
|
| Vitamin B5 | 1.03mg | 0.698mg |
|
| Vitamin B6 | 0.4mg | 0.464mg |
|
| Vitamin B12 | 0.3µg | 0.7µg |
|
| Vitamin K | 2.4µg | 0µg |
|
| Folate | 5µg | 5µg | |
| Choline | 65.9mg | 93.9mg |
|
| Saturated Fat | 3.79g | 5.23g |
|
| Monounsaturated Fat | 5.34g | 6.19g |
|
| Polyunsaturated fat | 2.97g | 1.2g |
|
| Tryptophan | 0.305mg | 0.338mg |
|
| Threonine | 1.128mg | 1.234mg |
|
| Isoleucine | 1.362mg | 1.26mg |
|
| Leucine | 1.986mg | 2.177mg |
|
| Lysine | 2.223mg | 2.446mg |
|
| Methionine | 0.726mg | 0.712mg |
|
| Phenylalanine | 1.061mg | 1.086mg |
|
| Valine | 1.325mg | 1.473mg |
|
| Histidine | 0.802mg | 1.067mg |
|
| Omega-3 - EPA | 0.01g | 0g |
|
| Omega-3 - DHA | 0.04g | 0g |
|
| Omega-3 - DPA | 0.02g | 0g |
|
Which food is preferable for your diet?
|
|
|
| Low Calories diet |
|
|
| Low Fats diet |
|
|
| Low Carbs diet | Equal | |
| Low Glycemic Index diet | Equal | |
People also compare


Vitamins & Minerals Daily Need Coverage Score
Comparison summary
References
All the values for which the sources are not specified explicitly are taken from FDA’s Food Central. The exact link to the food presented on this page can be found below.
- Chicken meat - https://fdc.nal.usda.gov/fdc-app.html#/food-details/171450/nutrients
- Pork - https://fdc.nal.usda.gov/fdc-app.html#/food-details/167820/nutrients
All the Daily Values are presented for males aged 31-50, for 2000-calorie diets.