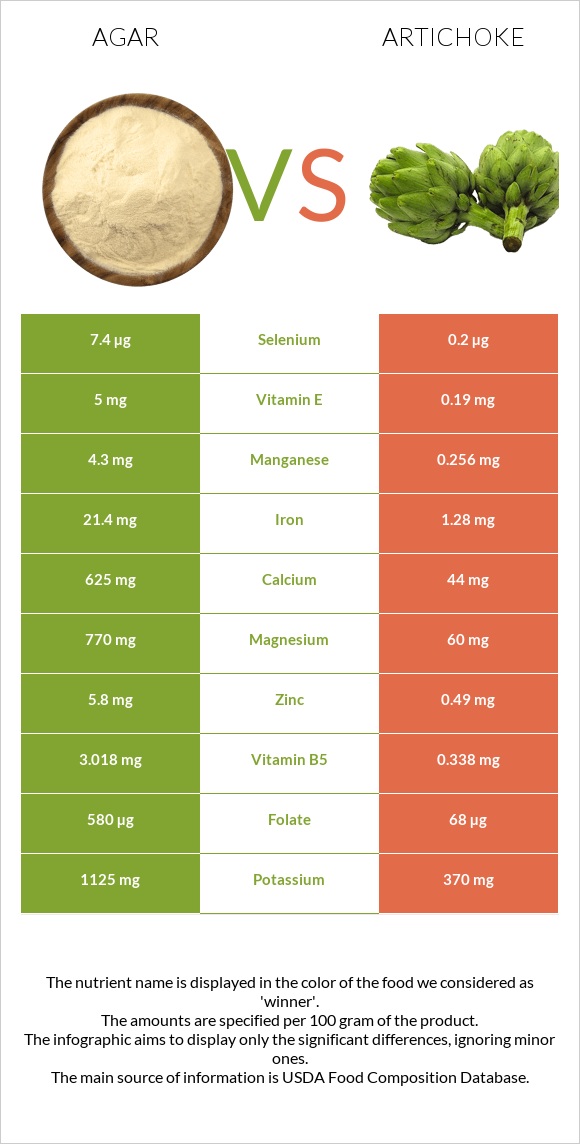
Significant differences between agar and artichoke The amount of iron, manganese, magnesium, folate, calcium, vitamin B5, zinc, copper, vitamin E, and potassium in agar is higher than in artichoke. Agar covers your daily iron needs 252% more than artichoke. Artichoke has 26 times less vitamin E than agar. Agar has 5mg of vitamin E, while artichoke has 0.19mg. Specific food types used in this comparison are Seaweed, agar, dried and Artichokes, (globe or french), raw .
Infographic
Mineral Comparison
Mineral comparison score is based on the number of minerals by which one or the other food is richer. The "coverage" charts below show how much of the daily needs can be covered by 300 grams of the food.
8
100 g
300 g
Magnesium
Magnesium
Calcium
Calcium
Potassium
Potassium
Iron
Iron
Copper
Copper
Zinc
Zinc
Phosphorus
Phosphorus
Sodium
Sodium
Manganese
Manganese
Selenium
Selenium
550%
188%
99%
803%
203%
158%
22%
13%
561%
40%
1
100 g
300 g
1 artichoke, medium - 128g 1 artichoke, large - 162g
Magnesium
Magnesium
Calcium
Calcium
Potassium
Potassium
Iron
Iron
Copper
Copper
Zinc
Zinc
Phosphorus
Phosphorus
Sodium
Sodium
Manganese
Manganese
Selenium
Selenium
43%
13%
33%
48%
77%
13%
39%
12%
33%
1.1%
Vitamin Comparison
Vitamin comparison score is based on the number of vitamins by which one or the other food is richer. The "coverage" charts below show how much of the daily needs can be covered by 300 grams of the food.
6
100 g
300 g
Vitamin C
Vit. C
Vitamin D
Vit. D
Vitamin A
Vit. A
Vitamin E
Vit. E
Vitamin B1
Vit. B1
Vitamin B2
Vit. B2
Vitamin B3
Vit. B3
Vitamin B5
Vit. B5
Vitamin B6
Vit. B6
Vitamin B12
Vit. B12
Vitamin K
Vit. K
Folate
Folate
0%
0%
0%
100%
2.5%
51%
3.8%
181%
70%
0%
61%
435%
4
100 g
300 g
1 artichoke, medium - 128g 1 artichoke, large - 162g
Vitamin C
Vit. C
Vitamin D
Vit. D
Vitamin A
Vit. A
Vitamin E
Vit. E
Vitamin B1
Vit. B1
Vitamin B2
Vit. B2
Vitamin B3
Vit. B3
Vitamin B5
Vit. B5
Vitamin B6
Vit. B6
Vitamin B12
Vit. B12
Vitamin K
Vit. K
Folate
Folate
39%
0%
0.33%
3.8%
18%
15%
20%
20%
27%
0%
37%
51%
All nutrients comparison - raw data values
Nutrient
DV% diff.
Iron
21.4mg
1.28mg
252%
Manganese
4.3mg
0.256mg
176%
Magnesium
770mg
60mg
169%
Folate
580µg
68µg
128%
Calcium
625mg
44mg
58%
Vitamin B5
3.018mg
0.338mg
54%
Zinc
5.8mg
0.49mg
48%
Copper
0.61mg
0.231mg
42%
Vitamin E
5mg
0.19mg
32%
Carbs
80.88g
10.51g
23%
Potassium
1125mg
370mg
22%
Vitamin B6
0.303mg
0.116mg
14%
Calories
306kcal
47kcal
13%
Vitamin C
0mg
11.7mg
13%
Selenium
7.4µg
0.2µg
13%
Vitamin B2
0.222mg
0.066mg
12%
Fiber
7.7g
5.4g
9%
Vitamin K
24.4µg
14.8µg
8%
Protein
6.21g
3.27g
6%
Phosphorus
52mg
90mg
5%
Vitamin B1
0.01mg
0.072mg
5%
Vitamin B3
0.202mg
1.046mg
5%
Choline
63.3mg
34.4mg
5%
Protein per 100 calories
2g
7g
N/A
Calories per 10 g protein
493kcal
144kcal
N/A
Weight per 100 calories
33g
213g
N/A
Fats
0.3g
0.15g
0%
Net carbs
73.18g
5.11g
N/A
Sugar
2.97g
0.99g
N/A
Sodium
102mg
94mg
0%
Vitamin A
0µg
1µg
0%
Saturated fat
0.061g
0.036g
0%
Monounsaturated fat
0.027g
0.005g
0%
Polyunsaturated fat
0.102g
0.064g
0%
Omega-3 - EPA
0.087g
0g
N/A
Macronutrient Comparison
Macronutrient breakdown side-by-side comparison
4
6%
81%
9%
4%
Protein:
6.21 g
Fats:
0.3 g
Carbs:
80.88 g
Water:
8.68 g
Other:
3.93 g
1
3%
11%
85%
Protein:
3.27 g
Fats:
0.15 g
Carbs:
10.51 g
Water:
84.94 g
Other:
1.13 g
Contains
more
Protein Protein
+89.9%
Contains
more
Fats Fats
+100%
Contains
more
Carbs Carbs
+669.6%
Contains
more
Other Other
+247.8%
Contains
more
Water Water
+878.6%
Fat Type Comparison
Fat type breakdown side-by-side comparison
2
32%
14%
54%
Saturated fat:
Sat. Fat
0.061 g
Monounsaturated fat:
Mono. Fat
0.027 g
Polyunsaturated fat:
Poly. Fat
0.102 g
1
34%
5%
61%
Saturated fat:
Sat. Fat
0.036 g
Monounsaturated fat:
Mono. Fat
0.005 g
Polyunsaturated fat:
Poly. Fat
0.064 g
Contains
more
Mono. Fat Monounsaturated fat
+440%
Contains
more
Poly. Fat Polyunsaturated fat
+59.4%
Contains
less
Sat. Fat Saturated fat
-41%