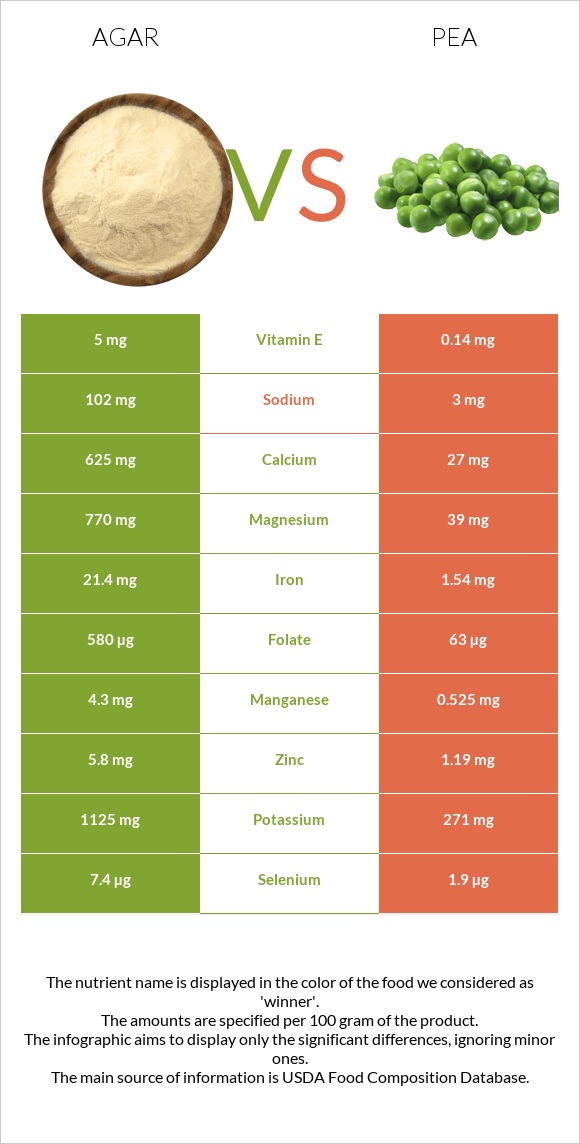
How are agar and peas different? Agar is richer in iron, magnesium, manganese, folate, calcium, copper, zinc, vitamin E, and potassium, while peas are higher in vitamin B5. Peas cover your daily need for vitamin B5, 3000% more than agar. Agar contains 36 times more vitamin E than peas. Agar contains 5mg of vitamin E, while peas contain 0.14mg. Seaweed, agar, dried and Peas, green, cooked, boiled, drained, without salt types were used in this article.
Infographic
Mineral Comparison
Mineral comparison score is based on the number of minerals by which one or the other food is richer. The "coverage" charts below show how much of the daily needs can be covered by 300 grams of the food.
8
100 g
300 g
Magnesium
Magnesium
Calcium
Calcium
Potassium
Potassium
Iron
Iron
Copper
Copper
Zinc
Zinc
Phosphorus
Phosphorus
Sodium
Sodium
Manganese
Manganese
Selenium
Selenium
550%
188%
99%
803%
203%
158%
22%
13%
561%
40%
2
100 g
300 g
1 cup - 160g
Magnesium
Magnesium
Calcium
Calcium
Potassium
Potassium
Iron
Iron
Copper
Copper
Zinc
Zinc
Phosphorus
Phosphorus
Sodium
Sodium
Manganese
Manganese
Selenium
Selenium
28%
8.1%
24%
58%
58%
32%
50%
0.39%
68%
10%
Vitamin Comparison
Vitamin comparison score is based on the number of vitamins by which one or the other food is richer. The "coverage" charts below show how much of the daily needs can be covered by 300 grams of the food.
4
100 g
300 g
Vitamin C
Vit. C
Vitamin D
Vit. D
Vitamin A
Vit. A
Vitamin E
Vit. E
Vitamin B1
Vit. B1
Vitamin B2
Vit. B2
Vitamin B3
Vit. B3
Vitamin B5
Vit. B5
Vitamin B6
Vit. B6
Vitamin B12
Vit. B12
Vitamin K
Vit. K
Folate
Folate
0%
0%
0%
100%
2.5%
51%
3.8%
181%
70%
0%
61%
435%
5
100 g
300 g
1 cup - 160g
Vitamin C
Vit. C
Vitamin D
Vit. D
Vitamin A
Vit. A
Vitamin E
Vit. E
Vitamin B1
Vit. B1
Vitamin B2
Vit. B2
Vitamin B3
Vit. B3
Vitamin B5
Vit. B5
Vitamin B6
Vit. B6
Vitamin B12
Vit. B12
Vitamin K
Vit. K
Folate
Folate
47%
0%
13%
2.8%
65%
34%
38%
9180%
50%
0%
65%
47%
All nutrients comparison - raw data values
Nutrient
DV% diff.
Vitamin B5
3.018mg
153mg
3000%
Iron
21.4mg
1.54mg
248%
Magnesium
770mg
39mg
174%
Manganese
4.3mg
0.525mg
164%
Folate
580µg
63µg
129%
Calcium
625mg
27mg
60%
Copper
0.61mg
0.173mg
49%
Zinc
5.8mg
1.19mg
42%
Vitamin E
5mg
0.14mg
32%
Potassium
1125mg
271mg
25%
Carbs
80.88g
15.63g
22%
Vitamin B1
0.01mg
0.259mg
21%
Vitamin C
0mg
14.2mg
16%
Calories
306kcal
84kcal
11%
Vitamin B3
0.202mg
2.021mg
11%
Selenium
7.4µg
1.9µg
10%
Fiber
7.7g
5.5g
9%
Phosphorus
52mg
117mg
9%
Vitamin B6
0.303mg
0.216mg
7%
Vitamin B2
0.222mg
0.149mg
6%
Choline
63.3mg
29.7mg
6%
Sodium
102mg
3mg
4%
Vitamin A
0µg
40µg
4%
Protein
6.21g
5.36g
2%
Vitamin K
24.4µg
25.9µg
1%
Fructose
0.41g
1%
Protein per 100 calories
2g
6.4g
N/A
Calories per 10 g protein
493kcal
157kcal
N/A
Weight per 100 calories
33g
119g
N/A
Fats
0.3g
0.22g
0%
Net carbs
73.18g
10.13g
N/A
Sugar
2.97g
5.93g
N/A
Saturated fat
0.061g
0.039g
0%
Monounsaturated fat
0.027g
0.019g
0%
Polyunsaturated fat
0.102g
0.102g
0%
Tryptophan
0.037mg
0%
Threonine
0.201mg
0%
Isoleucine
0.193mg
0%
Leucine
0.32mg
0%
Lysine
0.314mg
0%
Methionine
0.081mg
0%
Phenylalanine
0.198mg
0%
Valine
0.232mg
0%
Histidine
0.105mg
0%
Omega-3 - EPA
0.087g
0g
N/A
Macronutrient Comparison
Macronutrient breakdown side-by-side comparison
4
6%
81%
9%
4%
Protein:
6.21 g
Fats:
0.3 g
Carbs:
80.88 g
Water:
8.68 g
Other:
3.93 g
1
5%
16%
78%
Protein:
5.36 g
Fats:
0.22 g
Carbs:
15.63 g
Water:
77.87 g
Other:
0.92 g
Contains
more
Protein Protein
+15.9%
Contains
more
Fats Fats
+36.4%
Contains
more
Carbs Carbs
+417.5%
Contains
more
Other Other
+327.2%
Contains
more
Water Water
+797.1%
Fat Type Comparison
Fat type breakdown side-by-side comparison
1
32%
14%
54%
Saturated fat:
Sat. Fat
0.061 g
Monounsaturated fat:
Mono. Fat
0.027 g
Polyunsaturated fat:
Poly. Fat
0.102 g
1
24%
12%
64%
Saturated fat:
Sat. Fat
0.039 g
Monounsaturated fat:
Mono. Fat
0.019 g
Polyunsaturated fat:
Poly. Fat
0.102 g
Contains
more
Mono. Fat Monounsaturated fat
+42.1%
Contains
less
Sat. Fat Saturated fat
-36.1%
~equal in
Polyunsaturated fat
~0.102g