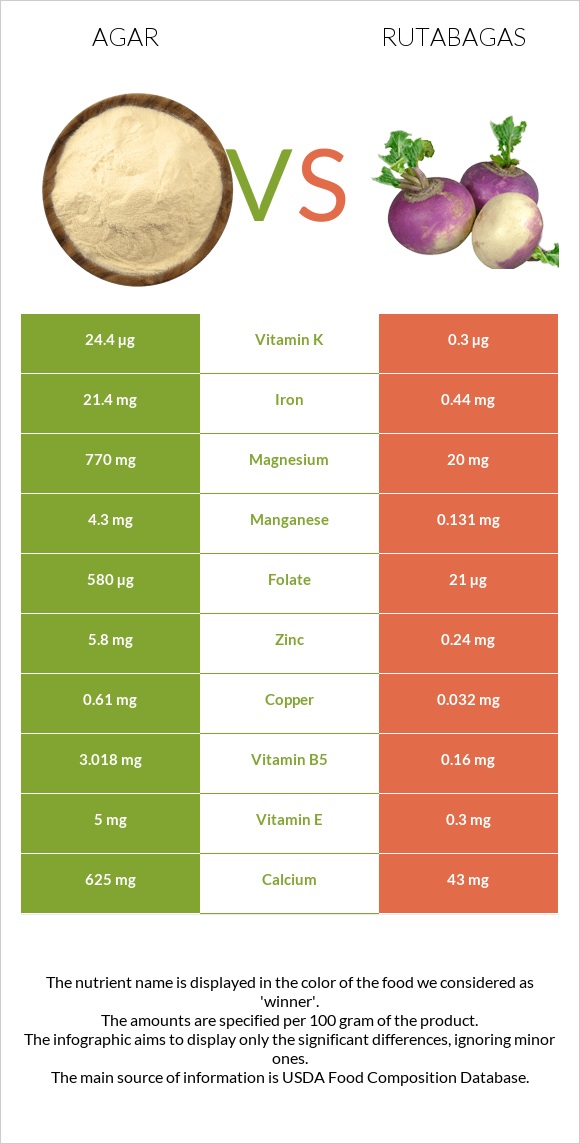
How are agar and rutabagas different? Agar is richer in iron, manganese, magnesium, folate, copper, calcium, vitamin B5, zinc, and vitamin E, while rutabagas are higher in vitamin C. Agar covers your daily need for iron, 262% more than rutabagas. Agar contains 39 times more magnesium than rutabagas. Agar contains 770mg of magnesium, while rutabagas contain 20mg. Seaweed, agar, dried and Rutabagas, raw types were used in this article.
Infographic
Mineral Comparison
Mineral comparison score is based on the number of minerals by which one or the other food is richer. The "coverage" charts below show how much of the daily needs can be covered by 300 grams of the food.
8
100 g
300 g
Magnesium
Magnesium
Calcium
Calcium
Potassium
Potassium
Iron
Iron
Copper
Copper
Zinc
Zinc
Phosphorus
Phosphorus
Sodium
Sodium
Manganese
Manganese
Selenium
Selenium
550%
188%
99%
803%
203%
158%
22%
13%
561%
40%
1
100 g
300 g
1 cup, cubes - 140g 1 small - 192g 1 medium - 386g 1 large - 772g
Magnesium
Magnesium
Calcium
Calcium
Potassium
Potassium
Iron
Iron
Copper
Copper
Zinc
Zinc
Phosphorus
Phosphorus
Sodium
Sodium
Manganese
Manganese
Selenium
Selenium
14%
13%
27%
17%
11%
6.5%
23%
1.6%
17%
3.8%
Vitamin Comparison
Vitamin comparison score is based on the number of vitamins by which one or the other food is richer. The "coverage" charts below show how much of the daily needs can be covered by 300 grams of the food.
6
100 g
300 g
Vitamin C
Vit. C
Vitamin D
Vit. D
Vitamin A
Vit. A
Vitamin E
Vit. E
Vitamin B1
Vit. B1
Vitamin B2
Vit. B2
Vitamin B3
Vit. B3
Vitamin B5
Vit. B5
Vitamin B6
Vit. B6
Vitamin B12
Vit. B12
Vitamin K
Vit. K
Folate
Folate
0%
0%
0%
100%
2.5%
51%
3.8%
181%
70%
0%
61%
435%
3
100 g
300 g
1 cup, cubes - 140g 1 small - 192g 1 medium - 386g 1 large - 772g
Vitamin C
Vit. C
Vitamin D
Vit. D
Vitamin A
Vit. A
Vitamin E
Vit. E
Vitamin B1
Vit. B1
Vitamin B2
Vit. B2
Vitamin B3
Vit. B3
Vitamin B5
Vit. B5
Vitamin B6
Vit. B6
Vitamin B12
Vit. B12
Vitamin K
Vit. K
Folate
Folate
83%
0%
0%
6%
23%
9.2%
13%
9.6%
23%
0%
0.75%
16%
All nutrients comparison - raw data values
Nutrient
DV% diff.
Iron
21.4mg
0.44mg
262%
Manganese
4.3mg
0.131mg
181%
Magnesium
770mg
20mg
179%
Folate
580µg
21µg
140%
Copper
0.61mg
0.032mg
64%
Calcium
625mg
43mg
58%
Vitamin B5
3.018mg
0.16mg
57%
Zinc
5.8mg
0.24mg
51%
Vitamin E
5mg
0.3mg
31%
Vitamin C
0mg
25mg
28%
Carbs
80.88g
8.62g
24%
Potassium
1125mg
305mg
24%
Fiber
7.7g
2.3g
22%
Vitamin K
24.4µg
0.3µg
20%
Vitamin B6
0.303mg
0.1mg
16%
Vitamin B2
0.222mg
0.04mg
14%
Calories
306kcal
37kcal
13%
Selenium
7.4µg
0.7µg
12%
Protein
6.21g
1.08g
10%
Choline
63.3mg
14.1mg
9%
Vitamin B1
0.01mg
0.09mg
7%
Sodium
102mg
12mg
4%
Vitamin B3
0.202mg
0.7mg
3%
Fructose
1.61g
2%
Protein per 100 calories
2g
2.9g
N/A
Calories per 10 g protein
493kcal
343kcal
N/A
Weight per 100 calories
33g
270g
N/A
Fats
0.3g
0.16g
0%
Net carbs
73.18g
6.32g
N/A
Sugar
2.97g
4.46g
N/A
Starch
0.4g
0%
Phosphorus
52mg
53mg
0%
Saturated fat
0.061g
0.027g
0%
Monounsaturated fat
0.027g
0.025g
0%
Polyunsaturated fat
0.102g
0.088g
0%
Omega-3 - EPA
0.087g
0g
N/A
Macronutrient Comparison
Macronutrient breakdown side-by-side comparison
4
6%
81%
9%
4%
Protein:
6.21 g
Fats:
0.3 g
Carbs:
80.88 g
Water:
8.68 g
Other:
3.93 g
1
9%
89%
Protein:
1.08 g
Fats:
0.16 g
Carbs:
8.62 g
Water:
89.43 g
Other:
0.71 g
Contains
more
Protein Protein
+475%
Contains
more
Fats Fats
+87.5%
Contains
more
Carbs Carbs
+838.3%
Contains
more
Other Other
+453.5%
Contains
more
Water Water
+930.3%
Fat Type Comparison
Fat type breakdown side-by-side comparison
2
32%
14%
54%
Saturated fat:
Sat. Fat
0.061 g
Monounsaturated fat:
Mono. Fat
0.027 g
Polyunsaturated fat:
Poly. Fat
0.102 g
1
19%
18%
63%
Saturated fat:
Sat. Fat
0.027 g
Monounsaturated fat:
Mono. Fat
0.025 g
Polyunsaturated fat:
Poly. Fat
0.088 g
Contains
more
Poly. Fat Polyunsaturated fat
+15.9%
Contains
less
Sat. Fat Saturated fat
-55.7%
~equal in
Monounsaturated fat
~0.025g