Almond butter vs. Almonds — In-Depth Nutrition Comparison
Compare
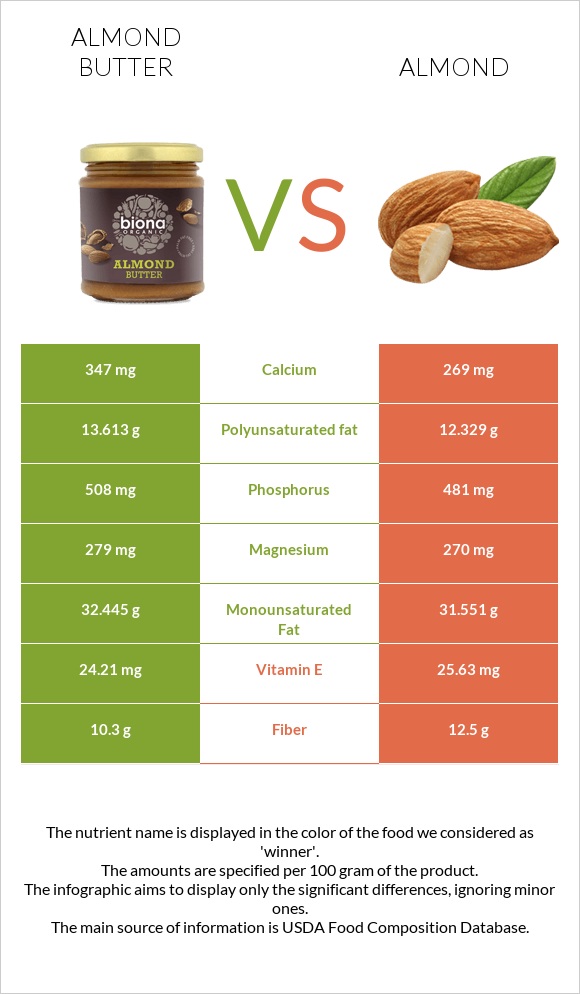
What are the main differences between almond butter and almonds?
- Almond butter is richer in calcium, monounsaturated fat, and polyunsaturated fat, yet almonds are richer in vitamin B2, vitamin B1, copper, vitamin E, and fiber.
- Almonds' daily need coverage for vitamin B2 is 15% higher.
We used Nuts, almond butter, plain, without salt added and Nuts, almonds types in this comparison.
Infographic
Infographic link
Mineral Comparison
Mineral comparison score is based on the number of minerals by which one or the other food is richer. The "coverage" charts below show how much of the daily needs can be covered by 300 grams of the food.
| Contains more CalciumCalcium | +29% |
| Contains more CopperCopper | +10.4% |
| Contains less SodiumSodium | -85.7% |
| Contains more SeleniumSelenium | +70.8% |
Vitamin Comparison
Vitamin comparison score is based on the number of vitamins by which one or the other food is richer. The "coverage" charts below show how much of the daily needs can be covered by 300 grams of the food.
| Contains more FolateFolate | +20.5% |
| Contains more Vitamin B1Vitamin B1 | +400% |
| Contains more Vitamin B2Vitamin B2 | +21.2% |
| Contains more Vitamin B3Vitamin B3 | +14.7% |
| Contains more Vitamin B5Vitamin B5 | +48.1% |
| Contains more Vitamin B6Vitamin B6 | +33% |
All nutrients comparison - raw data values
| Nutrient |  |
 |
DV% diff. |
| Vitamin B2 | 0.939mg | 1.138mg | 15% |
| Vitamin B1 | 0.041mg | 0.205mg | 14% |
| Copper | 0.934mg | 1.031mg | 11% |
| Fats | 55.5g | 49.93g | 9% |
| Fiber | 10.3g | 12.5g | 9% |
| Vitamin E | 24.21mg | 25.63mg | 9% |
| Polyunsaturated fat | 13.613g | 12.329g | 9% |
| Calcium | 347mg | 269mg | 8% |
| Phosphorus | 508mg | 481mg | 4% |
| Iron | 3.49mg | 3.71mg | 3% |
| Selenium | 2.4µg | 4.1µg | 3% |
| Vitamin B3 | 3.155mg | 3.618mg | 3% |
| Vitamin B5 | 0.318mg | 0.471mg | 3% |
| Vitamin B6 | 0.103mg | 0.137mg | 3% |
| Calories | 614kcal | 579kcal | 2% |
| Magnesium | 279mg | 270mg | 2% |
| Zinc | 3.29mg | 3.12mg | 2% |
| Manganese | 2.131mg | 2.179mg | 2% |
| Folate | 53µg | 44µg | 2% |
| Saturated fat | 4.152g | 3.802g | 2% |
| Monounsaturated fat | 32.445g | 31.551g | 2% |
| Carbs | 18.82g | 21.55g | 1% |
| Protein | 20.96g | 21.15g | 0% |
| Protein per 100 calories | 3.4g | 3.7g | N/A |
| Calories per 10 g protein | 293kcal | 274kcal | N/A |
| Weight per 100 calories | 16g | 17g | N/A |
| Unsaturated / Saturated Fat ratio | 11 | 12 | N/A |
| Net carbs | 8.52g | 9.05g | N/A |
| Potassium | 748mg | 733mg | 0% |
| Sugar | 4.43g | 4.35g | N/A |
| Starch | 0.08g | 0.72g | 0% |
| Sodium | 7mg | 1mg | 0% |
| Trans fat | 0.015g | N/A | |
| Choline | 52.1mg | 52.1mg | 0% |
| Tryptophan | 0.159mg | 0.211mg | 0% |
| Threonine | 0.555mg | 0.601mg | 0% |
| Isoleucine | 0.813mg | 0.751mg | 0% |
| Leucine | 1.483mg | 1.473mg | 0% |
| Lysine | 0.612mg | 0.568mg | 0% |
| Methionine | 0.122mg | 0.157mg | 0% |
| Phenylalanine | 1.149mg | 1.132mg | 0% |
| Valine | 0.937mg | 0.855mg | 0% |
| Histidine | 0.55mg | 0.539mg | 0% |
| Fructose | 0g | 0.11g | 0% |
| Omega-3 - ALA | 0.003g | N/A | |
| Omega-6 - Eicosadienoic acid | 0g | 0.002g | N/A |
| Omega-6 - Linoleic acid | 12.32g | N/A |
Macronutrient Comparison
Macronutrient breakdown side-by-side comparison
Protein:
20.96 g
Fats:
55.5 g
Carbs:
18.82 g
Water:
1.64 g
Other:
3.08 g
Protein:
21.15 g
Fats:
49.93 g
Carbs:
21.55 g
Water:
4.41 g
Other:
2.96 g
| Contains more CarbsCarbs | +14.5% |
| Contains more WaterWater | +168.9% |
~equal in
Protein
~21.15g
~equal in
Fats
~49.93g
~equal in
Other
~2.96g
Fat Type Comparison
Fat type breakdown side-by-side comparison
Saturated fat:
Sat. Fat
4.152 g
Monounsaturated fat:
Mono. Fat
32.445 g
Polyunsaturated fat:
Poly. Fat
13.613 g
Saturated fat:
Sat. Fat
3.802 g
Monounsaturated fat:
Mono. Fat
31.551 g
Polyunsaturated fat:
Poly. Fat
12.329 g
~equal in
Saturated fat
~3.802g
~equal in
Monounsaturated fat
~31.551g
~equal in
Polyunsaturated fat
~12.329g
Carbohydrate type comparison
Carbohydrate type breakdown side-by-side comparison
Starch:
0.08 g
Sucrose:
4.34 g
Glucose:
0.02 g
Fructose:
0 g
Lactose:
0 g
Maltose:
0.07 g
Galactose:
0 g
Starch:
0.72 g
Sucrose:
3.95 g
Glucose:
0.17 g
Fructose:
0.11 g
Lactose:
0 g
Maltose:
0.04 g
Galactose:
0.07 g
| Contains more MaltoseMaltose | +75% |
| Contains more StarchStarch | +800% |
| Contains more GlucoseGlucose | +750% |
| Contains more FructoseFructose | +∞% |
| Contains more GalactoseGalactose | +∞% |
~equal in
Sucrose
~3.95g
~equal in
Lactose
~0g


