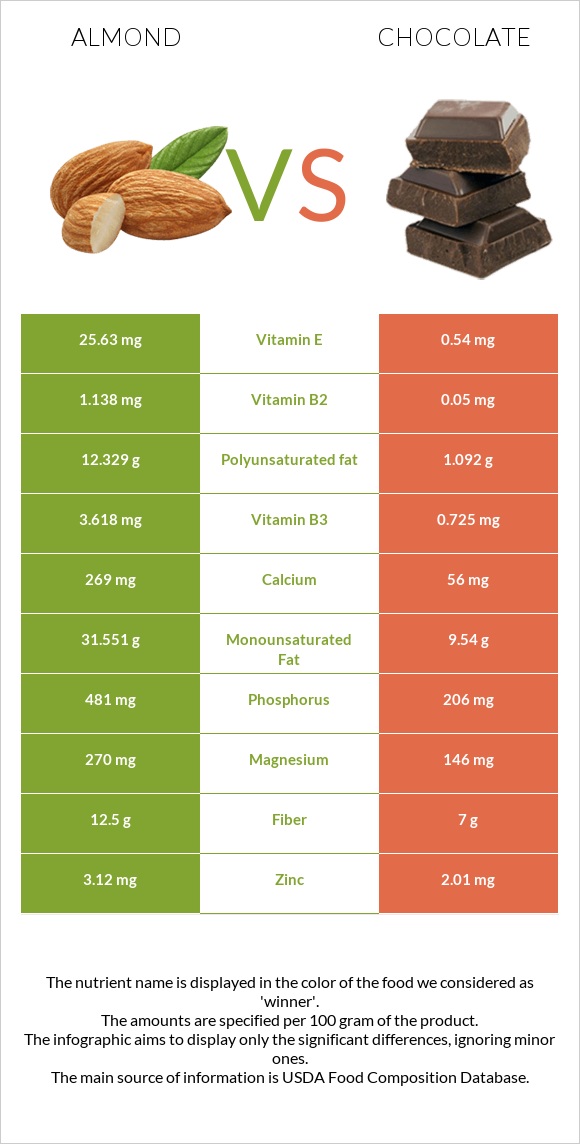
Summary of differences between almonds and chocolate Almonds have more vitamin E, vitamin B2, phosphorus, manganese, magnesium, fiber, calcium, and vitamin B3, while chocolate has more iron. Almonds cover your daily need for vitamin E, 167% more than chocolate. Almonds contain 23 times more vitamin B2 than chocolate. While almonds contain 1.138mg of vitamin B2, chocolate contains only 0.05mg. The amount of saturated fat in almonds is lower. Almonds have a lower glycemic index. The glycemic index of almonds is 0, while the glycemic index of chocolate is 23. These are the specific foods used in this comparison Nuts, almonds and Chocolate, dark, 45- 59% cacao solids .
Infographic
Mineral Comparison
Mineral comparison score is based on the number of minerals by which one or the other food is richer. The "coverage" charts below show how much of the daily needs can be covered by 300 grams of the food.
8
100 g
300 g
1 almond - 1.2g 1 oz (23 whole kernels) - 28.35g 1 cup, sliced - 92g 1 cup, ground - 95g 1 cup, slivered - 108g 1 cup, whole - 143g
Magnesium
Magnesium
Calcium
Calcium
Potassium
Potassium
Iron
Iron
Copper
Copper
Zinc
Zinc
Phosphorus
Phosphorus
Sodium
Sodium
Manganese
Manganese
Selenium
Selenium
193%
81%
65%
139%
344%
85%
206%
0.13%
284%
22%
1
100 g
300 g
1 oz - 28.35g 1 bar - 162g
Magnesium
Magnesium
Calcium
Calcium
Potassium
Potassium
Iron
Iron
Copper
Copper
Zinc
Zinc
Phosphorus
Phosphorus
Sodium
Sodium
Manganese
Manganese
Selenium
Selenium
104%
17%
49%
301%
343%
55%
88%
3.1%
185%
16%
Vitamin Comparison
Vitamin comparison score is based on the number of vitamins by which one or the other food is richer. The "coverage" charts below show how much of the daily needs can be covered by 300 grams of the food.
7
100 g
300 g
1 almond - 1.2g 1 oz (23 whole kernels) - 28.35g 1 cup, sliced - 92g 1 cup, ground - 95g 1 cup, slivered - 108g 1 cup, whole - 143g
Vitamin C
Vit. C
Vitamin D
Vit. D
Vitamin A
Vit. A
Vitamin E
Vit. E
Vitamin B1
Vit. B1
Vitamin B2
Vit. B2
Vitamin B3
Vit. B3
Vitamin B5
Vit. B5
Vitamin B6
Vit. B6
Vitamin B12
Vit. B12
Vitamin K
Vit. K
Folate
Folate
0%
0%
0%
513%
51%
263%
68%
28%
32%
0%
0%
33%
3
100 g
300 g
1 oz - 28.35g 1 bar - 162g
Vitamin C
Vit. C
Vitamin D
Vit. D
Vitamin A
Vit. A
Vitamin E
Vit. E
Vitamin B1
Vit. B1
Vitamin B2
Vit. B2
Vitamin B3
Vit. B3
Vitamin B5
Vit. B5
Vitamin B6
Vit. B6
Vitamin B12
Vit. B12
Vitamin K
Vit. K
Folate
Folate
0%
0%
0.67%
11%
6.3%
12%
14%
18%
9.7%
29%
20%
0%
All nutrients comparison - raw data values
Nutrient
DV% diff.
Vitamin E
25.63mg
0.54mg
167%
Vitamin B2
1.138mg
0.05mg
84%
Polyunsaturated fat
12.329g
1.092g
75%
Saturated fat
3.802g
18.519g
67%
Monounsaturated fat
31.551g
9.54g
55%
Iron
3.71mg
8.02mg
54%
Phosphorus
481mg
206mg
39%
Protein
21.15g
4.88g
33%
Manganese
2.179mg
1.419mg
33%
Magnesium
270mg
146mg
30%
Fats
49.93g
31.28g
29%
Fiber
12.5g
7g
22%
Calcium
269mg
56mg
21%
Vitamin B3
3.618mg
0.725mg
18%
Vitamin B1
0.205mg
0.025mg
15%
Carbs
21.55g
61.17g
13%
Folate
44µg
11%
Caffeine
0mg
43mg
11%
Zinc
3.12mg
2.01mg
10%
Vitamin B12
0µg
0.23µg
10%
Choline
52.1mg
9%
Vitamin B6
0.137mg
0.042mg
7%
Vitamin K
0µg
8.1µg
7%
Potassium
733mg
559mg
5%
Cholesterol
0mg
8mg
3%
Vitamin B5
0.471mg
0.297mg
3%
Calories
579kcal
546kcal
2%
Selenium
4.1µg
3µg
2%
Sodium
1mg
24mg
1%
Protein per 100 calories
3.7g
0.89g
N/A
Calories per 10 g protein
274kcal
1119kcal
N/A
Weight per 100 calories
17g
18g
N/A
Unsaturated / Saturated Fat ratio
12
0.57
N/A
Net carbs
9.05g
54.17g
N/A
Sugar
4.35g
47.9g
N/A
Copper
1.031mg
1.028mg
0%
Starch
0.72g
0%
Vitamin A
0µg
2µg
0%
Trans fat
0.015g
0.112g
N/A
Tryptophan
0.211mg
0%
Threonine
0.601mg
0%
Isoleucine
0.751mg
0%
Leucine
1.473mg
0%
Lysine
0.568mg
0%
Methionine
0.157mg
0%
Phenylalanine
1.132mg
0%
Valine
0.855mg
0%
Histidine
0.539mg
0%
Fructose
0.11g
0g
0%
Omega-3 - EPA
0g
0.001g
N/A
Omega-3 - ALA
0.003g
0.085g
N/A
Omega-6 - Eicosadienoic acid
0.002g
0.001g
N/A
Omega-6 - Linoleic acid
12.32g
0.947g
N/A
Macronutrient Comparison
Macronutrient breakdown side-by-side comparison
4
21%
50%
22%
4%
3%
Protein:
21.15 g
Fats:
49.93 g
Carbs:
21.55 g
Water:
4.41 g
Other:
2.96 g
1
5%
31%
61%
2%
Protein:
4.88 g
Fats:
31.28 g
Carbs:
61.17 g
Water:
0.97 g
Other:
1.7 g
Contains
more
Protein Protein
+333.4%
Contains
more
Fats Fats
+59.6%
Contains
more
Water Water
+354.6%
Contains
more
Other Other
+74.1%
Contains
more
Carbs Carbs
+183.9%
Fat Type Comparison
Fat type breakdown side-by-side comparison
3
8%
66%
26%
Saturated fat:
Sat. Fat
3.802 g
Monounsaturated fat:
Mono. Fat
31.551 g
Polyunsaturated fat:
Poly. Fat
12.329 g
0
64%
33%
4%
Saturated fat:
Sat. Fat
18.519 g
Monounsaturated fat:
Mono. Fat
9.54 g
Polyunsaturated fat:
Poly. Fat
1.092 g
Contains
less
Sat. Fat Saturated fat
-79.5%
Contains
more
Mono. Fat Monounsaturated fat
+230.7%
Contains
more
Poly. Fat Polyunsaturated fat
+1029%
Carbohydrate type comparison
Carbohydrate type breakdown side-by-side comparison
5
14%
78%
3%
2%
Starch:
0.72 g
Sucrose:
3.95 g
Glucose:
0.17 g
Fructose:
0.11 g
Lactose:
0 g
Maltose:
0.04 g
Galactose:
0.07 g
2
97%
3%
Starch:
0 g
Sucrose:
46.25 g
Glucose:
0 g
Fructose:
0 g
Lactose:
1.65 g
Maltose:
0 g
Galactose:
0 g
Contains
more
Starch Starch
+∞%
Contains
more
Glucose Glucose
+∞%
Contains
more
Fructose Fructose
+∞%
Contains
more
Maltose Maltose
+∞%
Contains
more
Galactose Galactose
+∞%
Contains
more
Sucrose Sucrose
+1070.9%
Contains
more
Lactose Lactose
+∞%