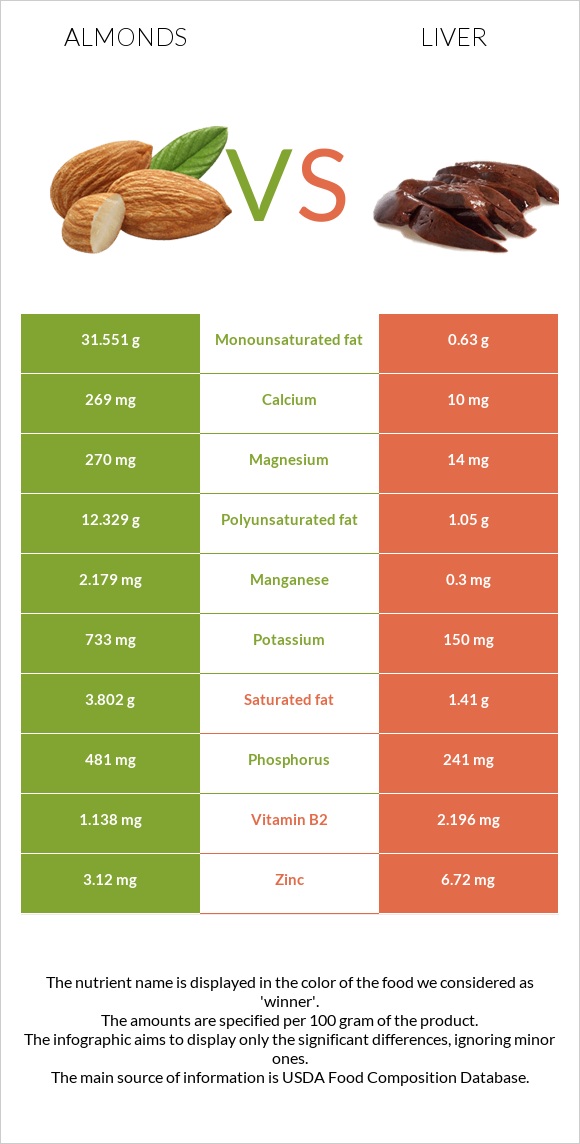
Important differences between almonds and liver Almonds have more manganese, magnesium, and fiber; however, liver is richer in vitamin B12, vitamin A, iron, selenium, vitamin B5, and vitamin B2. Liver's daily need coverage for vitamin B12 is 778% more. The food varieties used in the comparison are Nuts, almonds and Pork, fresh, variety meats, and by-products, liver, cooked, braised .
Infographic
Mineral Comparison
Mineral comparison score is based on the number of minerals by which one or the other food is richer. The "coverage" charts below show how much of the daily needs can be covered by 300 grams of the food.
7
100 g
300 g
1 almond - 1.2g 1 oz (23 whole kernels) - 28.35g 1 cup, sliced - 92g 1 cup, ground - 95g 1 cup, slivered - 108g 1 cup, whole - 143g
Magnesium
Magnesium
Calcium
Calcium
Potassium
Potassium
Iron
Iron
Copper
Copper
Zinc
Zinc
Phosphorus
Phosphorus
Sodium
Sodium
Manganese
Manganese
Selenium
Selenium
193%
81%
65%
139%
344%
85%
206%
0.13%
284%
22%
3
100 g
300 g
3 oz - 85g
Magnesium
Magnesium
Calcium
Calcium
Potassium
Potassium
Iron
Iron
Copper
Copper
Zinc
Zinc
Phosphorus
Phosphorus
Sodium
Sodium
Manganese
Manganese
Selenium
Selenium
10%
3%
13%
672%
211%
183%
103%
6.4%
39%
368%
Vitamin Comparison
Vitamin comparison score is based on the number of vitamins by which one or the other food is richer. The "coverage" charts below show how much of the daily needs can be covered by 300 grams of the food.
1
100 g
300 g
1 almond - 1.2g 1 oz (23 whole kernels) - 28.35g 1 cup, sliced - 92g 1 cup, ground - 95g 1 cup, slivered - 108g 1 cup, whole - 143g
Vitamin C
Vit. C
Vitamin D
Vit. D
Vitamin A
Vit. A
Vitamin E
Vit. E
Vitamin B1
Vit. B1
Vitamin B2
Vit. B2
Vitamin B3
Vit. B3
Vitamin B5
Vit. B5
Vitamin B6
Vit. B6
Vitamin B12
Vit. B12
Vitamin K
Vit. K
Folate
Folate
0%
0%
0%
513%
51%
263%
68%
28%
32%
0%
0%
33%
9
100 g
300 g
3 oz - 85g
Vitamin C
Vit. C
Vitamin D
Vit. D
Vitamin A
Vit. A
Vitamin E
Vit. E
Vitamin B1
Vit. B1
Vitamin B2
Vit. B2
Vitamin B3
Vit. B3
Vitamin B5
Vit. B5
Vitamin B6
Vit. B6
Vitamin B12
Vit. B12
Vitamin K
Vit. K
Folate
Folate
79%
0%
1802%
0%
65%
507%
158%
286%
132%
2334%
0%
122%
All nutrients comparison - raw data values
Nutrient
DV% diff.
Vitamin B12
0µg
18.67µg
778%
Vitamin A
0µg
5405µg
601%
Iron
3.71mg
17.92mg
178%
Vitamin E
25.63mg
171%
Cholesterol
0mg
355mg
118%
Selenium
4.1µg
67.5µg
115%
Vitamin B5
0.471mg
4.774mg
86%
Manganese
2.179mg
0.3mg
82%
Vitamin B2
1.138mg
2.196mg
81%
Monounsaturated fat
31.551g
0.63g
77%
Polyunsaturated fat
12.329g
1.05g
75%
Fats
49.93g
4.4g
70%
Magnesium
270mg
14mg
61%
Fiber
12.5g
0g
50%
Copper
1.031mg
0.634mg
44%
Phosphorus
481mg
241mg
34%
Zinc
3.12mg
6.72mg
33%
Vitamin B6
0.137mg
0.57mg
33%
Vitamin B3
3.618mg
8.435mg
30%
Folate
44µg
163µg
30%
Vitamin C
0mg
23.6mg
26%
Calcium
269mg
10mg
26%
Calories
579kcal
165kcal
21%
Potassium
733mg
150mg
17%
Saturated fat
3.802g
1.41g
11%
Protein
21.15g
26.02g
10%
Choline
52.1mg
9%
Carbs
21.55g
3.76g
6%
Vitamin B1
0.205mg
0.258mg
4%
Sodium
1mg
49mg
2%
Protein per 100 calories
3.7g
16g
N/A
Calories per 10 g protein
274kcal
63kcal
N/A
Weight per 100 calories
17g
61g
N/A
Unsaturated / Saturated Fat ratio
12
1.2
N/A
Net carbs
9.05g
3.76g
N/A
Sugar
4.35g
N/A
Starch
0.72g
0%
Trans fat
0.015g
N/A
Tryptophan
0.211mg
0.366mg
0%
Threonine
0.601mg
1.107mg
0%
Isoleucine
0.751mg
1.32mg
0%
Leucine
1.473mg
2.319mg
0%
Lysine
0.568mg
2.007mg
0%
Methionine
0.157mg
0.645mg
0%
Phenylalanine
1.132mg
1.274mg
0%
Valine
0.855mg
1.607mg
0%
Histidine
0.539mg
0.708mg
0%
Fructose
0.11g
0%
Omega-3 - DHA
0g
0.03g
N/A
Omega-3 - ALA
0.003g
N/A
Omega-3 - DPA
0g
0.04g
N/A
Omega-6 - Eicosadienoic acid
0.002g
N/A
Omega-6 - Linoleic acid
12.32g
N/A
Macronutrient Comparison
Macronutrient breakdown side-by-side comparison
3
21%
50%
22%
4%
3%
Protein:
21.15 g
Fats:
49.93 g
Carbs:
21.55 g
Water:
4.41 g
Other:
2.96 g
2
26%
4%
4%
64%
Protein:
26.02 g
Fats:
4.4 g
Carbs:
3.76 g
Water:
64.32 g
Other:
1.5 g
Contains
more
Fats Fats
+1034.8%
Contains
more
Carbs Carbs
+473.1%
Contains
more
Other Other
+97.3%
Contains
more
Protein Protein
+23%
Contains
more
Water Water
+1358.5%
Fat Type Comparison
Fat type breakdown side-by-side comparison
2
8%
66%
26%
Saturated fat:
Sat. Fat
3.802 g
Monounsaturated fat:
Mono. Fat
31.551 g
Polyunsaturated fat:
Poly. Fat
12.329 g
1
46%
20%
34%
Saturated fat:
Sat. Fat
1.41 g
Monounsaturated fat:
Mono. Fat
0.63 g
Polyunsaturated fat:
Poly. Fat
1.05 g
Contains
more
Mono. Fat Monounsaturated fat
+4908.1%
Contains
more
Poly. Fat Polyunsaturated fat
+1074.2%
Contains
less
Sat. Fat Saturated fat
-62.9%