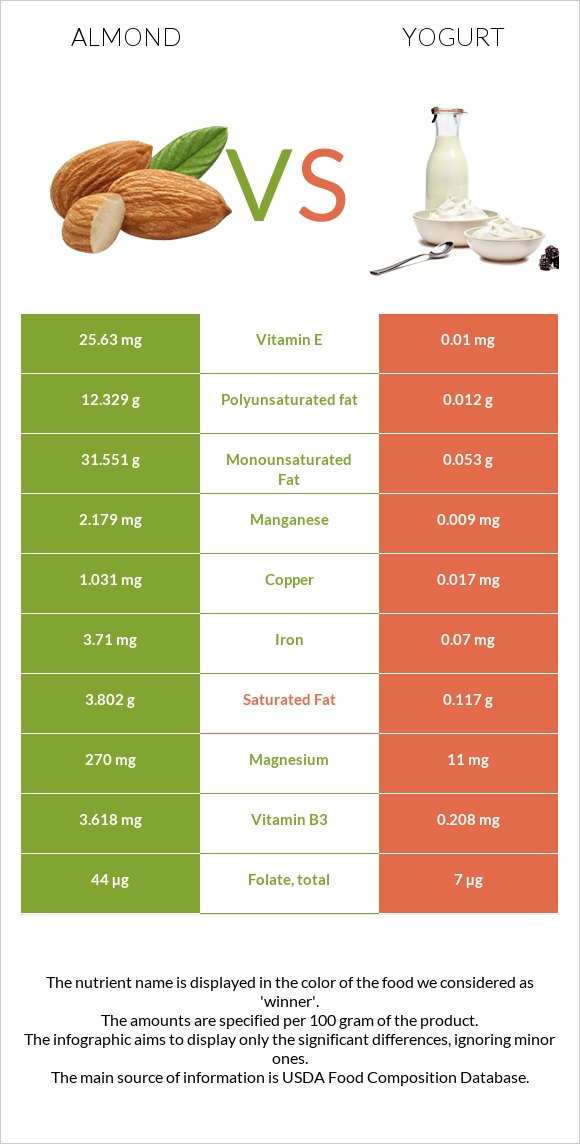
What are the differences between almonds and yogurt? Almonds are higher in vitamin E, copper, manganese, vitamin B2, magnesium, fiber, phosphorus, iron, and zinc, yet yogurt is higher in vitamin B12. Almonds' daily need coverage for vitamin E is 171% more. The glycemic index of almonds is lower. We used Nuts, almonds and Yogurt, Greek, plain, nonfat types in this article.
Infographic
Mineral Comparison
Mineral comparison score is based on the number of minerals by which one or the other food is richer. The "coverage" charts below show how much of the daily needs can be covered by 300 grams of the food.
9
100 g
300 g
1 almond - 1.2g 1 oz (23 whole kernels) - 28.35g 1 cup, sliced - 92g 1 cup, ground - 95g 1 cup, slivered - 108g 1 cup, whole - 143g
Magnesium
Magnesium
Calcium
Calcium
Potassium
Potassium
Iron
Iron
Copper
Copper
Zinc
Zinc
Phosphorus
Phosphorus
Sodium
Sodium
Manganese
Manganese
Selenium
Selenium
193%
81%
65%
139%
344%
85%
206%
0.13%
284%
22%
1
100 g
300 g
1 container - 170g
Magnesium
Magnesium
Calcium
Calcium
Potassium
Potassium
Iron
Iron
Copper
Copper
Zinc
Zinc
Phosphorus
Phosphorus
Sodium
Sodium
Manganese
Manganese
Selenium
Selenium
7.9%
33%
12%
2.6%
5.7%
14%
58%
4.7%
1.2%
53%
Vitamin Comparison
Vitamin comparison score is based on the number of vitamins by which one or the other food is richer. The "coverage" charts below show how much of the daily needs can be covered by 300 grams of the food.
7
100 g
300 g
1 almond - 1.2g 1 oz (23 whole kernels) - 28.35g 1 cup, sliced - 92g 1 cup, ground - 95g 1 cup, slivered - 108g 1 cup, whole - 143g
Vitamin C
Vit. C
Vitamin D
Vit. D
Vitamin A
Vit. A
Vitamin E
Vit. E
Vitamin B1
Vit. B1
Vitamin B2
Vit. B2
Vitamin B3
Vit. B3
Vitamin B5
Vit. B5
Vitamin B6
Vit. B6
Vitamin B12
Vit. B12
Vitamin K
Vit. K
Folate
Folate
0%
0%
0%
513%
51%
263%
68%
28%
32%
0%
0%
33%
2
100 g
300 g
1 container - 170g
Vitamin C
Vit. C
Vitamin D
Vit. D
Vitamin A
Vit. A
Vitamin E
Vit. E
Vitamin B1
Vit. B1
Vitamin B2
Vit. B2
Vitamin B3
Vit. B3
Vitamin B5
Vit. B5
Vitamin B6
Vit. B6
Vitamin B12
Vit. B12
Vitamin K
Vit. K
Folate
Folate
0%
0%
0.33%
0.2%
5.8%
64%
3.9%
20%
15%
94%
0%
5.3%
All nutrients comparison - raw data values
Nutrient
DV% diff.
Vitamin E
25.63mg
0.01mg
171%
Copper
1.031mg
0.017mg
113%
Manganese
2.179mg
0.009mg
94%
Polyunsaturated fat
12.329g
0.012g
82%
Monounsaturated fat
31.551g
0.053g
79%
Fats
49.93g
0.39g
76%
Vitamin B2
1.138mg
0.278mg
66%
Magnesium
270mg
11mg
62%
Fiber
12.5g
0g
50%
Phosphorus
481mg
135mg
49%
Iron
3.71mg
0.07mg
46%
Vitamin B12
0µg
0.75µg
31%
Calories
579kcal
59kcal
26%
Zinc
3.12mg
0.52mg
24%
Protein
21.15g
10.19g
22%
Vitamin B3
3.618mg
0.208mg
21%
Potassium
733mg
141mg
17%
Saturated fat
3.802g
0.117g
17%
Calcium
269mg
110mg
16%
Vitamin B1
0.205mg
0.023mg
15%
Selenium
4.1µg
9.7µg
10%
Folate
44µg
7µg
9%
Choline
52.1mg
15.1mg
7%
Carbs
21.55g
3.6g
6%
Vitamin B6
0.137mg
0.063mg
6%
Vitamin B5
0.471mg
0.331mg
3%
Cholesterol
0mg
5mg
2%
Sodium
1mg
36mg
2%
Protein per 100 calories
3.7g
17g
N/A
Calories per 10 g protein
274kcal
58kcal
N/A
Weight per 100 calories
17g
169g
N/A
Unsaturated / Saturated Fat ratio
12
0.56
N/A
Net carbs
9.05g
3.6g
N/A
Sugar
4.35g
3.24g
N/A
Starch
0.72g
0%
Vitamin A
0µg
1µg
0%
Trans fat
0.015g
0.006g
N/A
Tryptophan
0.211mg
0%
Threonine
0.601mg
0%
Isoleucine
0.751mg
0%
Leucine
1.473mg
0%
Lysine
0.568mg
0%
Methionine
0.157mg
0%
Phenylalanine
1.132mg
0%
Valine
0.855mg
0%
Histidine
0.539mg
0%
Fructose
0.11g
0g
0%
Omega-3 - ALA
0.003g
0.001g
N/A
Omega-6 - Eicosadienoic acid
0.002g
0g
N/A
Omega-6 - Linoleic acid
12.32g
0.01g
N/A
Macronutrient Comparison
Macronutrient breakdown side-by-side comparison
4
21%
50%
22%
4%
3%
Protein:
21.15 g
Fats:
49.93 g
Carbs:
21.55 g
Water:
4.41 g
Other:
2.96 g
1
10%
4%
85%
Protein:
10.19 g
Fats:
0.39 g
Carbs:
3.6 g
Water:
85.1 g
Other:
0.72 g
Contains
more
Protein Protein
+107.6%
Contains
more
Fats Fats
+12702.6%
Contains
more
Carbs Carbs
+498.6%
Contains
more
Other Other
+311.1%
Contains
more
Water Water
+1829.7%
Fat Type Comparison
Fat type breakdown side-by-side comparison
2
8%
66%
26%
Saturated fat:
Sat. Fat
3.802 g
Monounsaturated fat:
Mono. Fat
31.551 g
Polyunsaturated fat:
Poly. Fat
12.329 g
1
64%
29%
7%
Saturated fat:
Sat. Fat
0.117 g
Monounsaturated fat:
Mono. Fat
0.053 g
Polyunsaturated fat:
Poly. Fat
0.012 g
Contains
more
Mono. Fat Monounsaturated fat
+59430.2%
Contains
more
Poly. Fat Polyunsaturated fat
+102641.7%
Contains
less
Sat. Fat Saturated fat
-96.9%
Carbohydrate type comparison
Carbohydrate type breakdown side-by-side comparison
5
14%
78%
3%
2%
Starch:
0.72 g
Sucrose:
3.95 g
Glucose:
0.17 g
Fructose:
0.11 g
Lactose:
0 g
Maltose:
0.04 g
Galactose:
0.07 g
2
78%
22%
Starch:
0 g
Sucrose:
0 g
Glucose:
0 g
Fructose:
0 g
Lactose:
2.54 g
Maltose:
0 g
Galactose:
0.7 g
Contains
more
Starch Starch
+∞%
Contains
more
Sucrose Sucrose
+∞%
Contains
more
Glucose Glucose
+∞%
Contains
more
Fructose Fructose
+∞%
Contains
more
Maltose Maltose
+∞%
Contains
more
Lactose Lactose
+∞%
Contains
more
Galactose Galactose
+900%