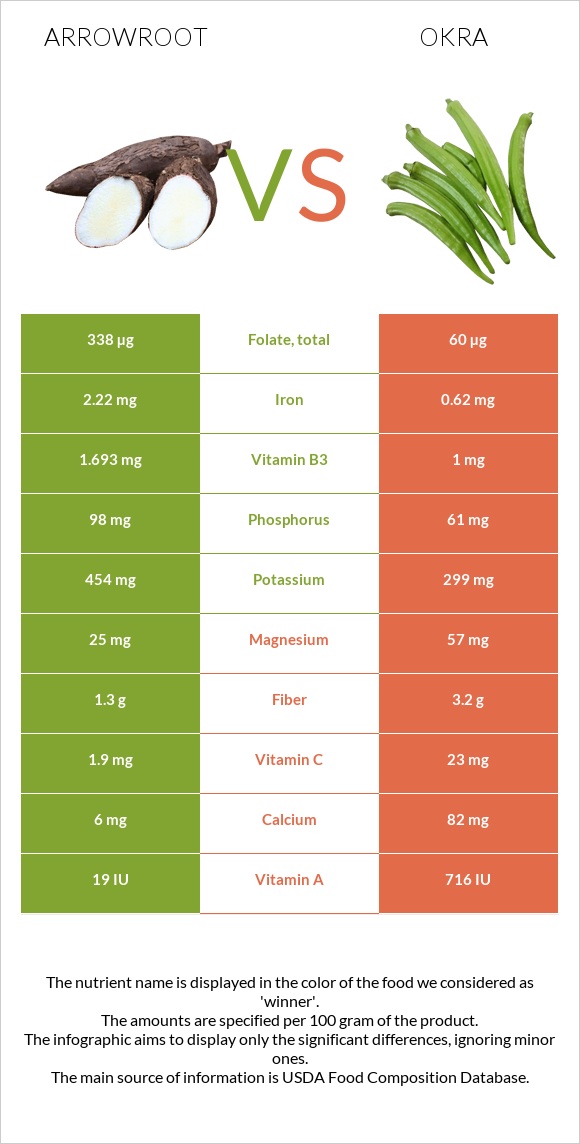
A recap on the differences between arrowroot and okra Arrowroot is higher in folate, iron, and phosphorus, yet okra is higher in manganese, vitamin C, vitamin A, magnesium, fiber, and calcium. Arrowroot covers your daily folate needs 70% more than okra. Arrowroot contains 4 times more iron than okra. While arrowroot contains 2.22mg of iron, okra contains only 0.62mg. Food varieties used in this article are Arrowroot, raw and Okra, raw .
Infographic
Mineral Comparison
Mineral comparison score is based on the number of minerals by which one or the other food is richer. The "coverage" charts below show how much of the daily needs can be covered by 300 grams of the food.
3
100 g
300 g
1 root - 33g 1 cup, sliced - 120g
Magnesium
Magnesium
Calcium
Calcium
Potassium
Potassium
Iron
Iron
Copper
Copper
Zinc
Zinc
Phosphorus
Phosphorus
Sodium
Sodium
Manganese
Manganese
Selenium
Selenium
18%
1.8%
40%
83%
40%
17%
42%
3.4%
23%
3.8%
4
100 g
300 g
8 pods (3" long) - 95g
Magnesium
Magnesium
Calcium
Calcium
Potassium
Potassium
Iron
Iron
Copper
Copper
Zinc
Zinc
Phosphorus
Phosphorus
Sodium
Sodium
Manganese
Manganese
Selenium
Selenium
41%
25%
26%
23%
36%
16%
26%
0.91%
103%
3.8%
Vitamin Comparison
Vitamin comparison score is based on the number of vitamins by which one or the other food is richer. The "coverage" charts below show how much of the daily needs can be covered by 300 grams of the food.
4
100 g
300 g
1 root - 33g 1 cup, sliced - 120g
Vitamin C
Vit. C
Vitamin D
Vit. D
Vitamin A
Vit. A
Vitamin E
Vit. E
Vitamin B1
Vit. B1
Vitamin B2
Vit. B2
Vitamin B3
Vit. B3
Vitamin B5
Vit. B5
Vitamin B6
Vit. B6
Vitamin B12
Vit. B12
Vitamin K
Vit. K
Folate
Folate
6.3%
0%
0.33%
0%
36%
14%
32%
18%
61%
0%
0%
254%
5
100 g
300 g
8 pods (3" long) - 95g
Vitamin C
Vit. C
Vitamin D
Vit. D
Vitamin A
Vit. A
Vitamin E
Vit. E
Vitamin B1
Vit. B1
Vitamin B2
Vit. B2
Vitamin B3
Vit. B3
Vitamin B5
Vit. B5
Vitamin B6
Vit. B6
Vitamin B12
Vit. B12
Vitamin K
Vit. K
Folate
Folate
77%
0%
12%
5.4%
50%
14%
19%
15%
50%
0%
78%
45%
All nutrients comparison - raw data values
Nutrient
DV% diff.
Folate
338µg
60µg
70%
Manganese
0.174mg
0.788mg
27%
Vitamin K
31.3µg
26%
Vitamin C
1.9mg
23mg
23%
Iron
2.22mg
0.62mg
20%
Magnesium
25mg
57mg
8%
Calcium
6mg
82mg
8%
Fiber
1.3g
3.2g
8%
Protein
4.24g
1.93g
5%
Potassium
454mg
299mg
5%
Phosphorus
98mg
61mg
5%
Vitamin B1
0.143mg
0.2mg
5%
Vitamin A
1µg
36µg
4%
Vitamin B3
1.693mg
1mg
4%
Vitamin B6
0.266mg
0.215mg
4%
Calories
65kcal
33kcal
2%
Carbs
13.39g
7.45g
2%
Vitamin E
0.27mg
2%
Choline
12.3mg
2%
Copper
0.121mg
0.109mg
1%
Sodium
26mg
7mg
1%
Vitamin B5
0.292mg
0.245mg
1%
Fructose
0.57g
1%
Protein per 100 calories
6.5g
5.8g
N/A
Calories per 10 g protein
153kcal
171kcal
N/A
Weight per 100 calories
154g
303g
N/A
Fats
0.2g
0.19g
0%
Net carbs
12.09g
4.25g
N/A
Sugar
1.48g
N/A
Zinc
0.63mg
0.58mg
0%
Starch
0.34g
0%
Selenium
0.7µg
0.7µg
0%
Vitamin B2
0.059mg
0.06mg
0%
Saturated fat
0.039g
0.026g
0%
Monounsaturated fat
0.004g
0.017g
0%
Polyunsaturated fat
0.092g
0.027g
0%
Tryptophan
0.017mg
0%
Threonine
0.065mg
0%
Isoleucine
0.069mg
0%
Leucine
0.105mg
0%
Lysine
0.081mg
0%
Methionine
0.021mg
0%
Phenylalanine
0.065mg
0%
Valine
0.091mg
0%
Histidine
0.031mg
0%
Macronutrient Comparison
Macronutrient breakdown side-by-side comparison
4
4%
13%
81%
Protein:
4.24 g
Fats:
0.2 g
Carbs:
13.39 g
Water:
80.75 g
Other:
1.42 g
1
2%
7%
90%
Protein:
1.93 g
Fats:
0.19 g
Carbs:
7.45 g
Water:
89.58 g
Other:
0.85 g
Contains
more
Protein Protein
+119.7%
Contains
more
Carbs Carbs
+79.7%
Contains
more
Other Other
+67.1%
Contains
more
Water Water
+10.9%
Fat Type Comparison
Fat type breakdown side-by-side comparison
1
29%
3%
68%
Saturated fat:
Sat. Fat
0.039 g
Monounsaturated fat:
Mono. Fat
0.004 g
Polyunsaturated fat:
Poly. Fat
0.092 g
2
37%
24%
39%
Saturated fat:
Sat. Fat
0.026 g
Monounsaturated fat:
Mono. Fat
0.017 g
Polyunsaturated fat:
Poly. Fat
0.027 g
Contains
more
Poly. Fat Polyunsaturated fat
+240.7%
Contains
less
Sat. Fat Saturated fat
-33.3%
Contains
more
Mono. Fat Monounsaturated fat
+325%