Babassu oil vs. Ginger ale — In-Depth Nutrition Comparison
Compare
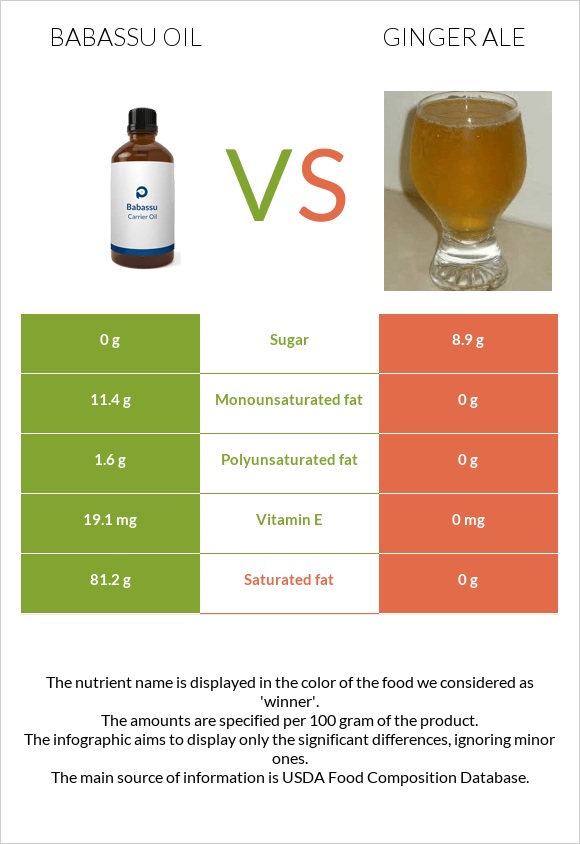
Significant differences between babassu oil and ginger ale
- The amount of vitamin E, monounsaturated fat, and polyunsaturated fat in babassu oil is higher than in ginger ale.
- Babassu oil covers your daily saturated fat needs 406% more than ginger ale.
- Ginger ale contains less saturated fat.
- Ginger ale has a higher glycemic index. The glycemic index of ginger ale is 63, while the glycemic index of babassu oil is 0.
Specific food types used in this comparison are Oil, babassu and Beverages, carbonated, ginger ale.
Infographic
Infographic link
Mineral Comparison
Mineral comparison score is based on the number of minerals by which one or the other food is richer. The "coverage" charts below show how much of the daily needs can be covered by 300 grams of the food.
| Contains less SodiumSodium | -100% |
| Contains more MagnesiumMagnesium | +∞% |
| Contains more CalciumCalcium | +∞% |
| Contains more PotassiumPotassium | +∞% |
| Contains more IronIron | +∞% |
| Contains more ZincZinc | +∞% |
| Contains more SeleniumSelenium | +∞% |
Vitamin Comparison
Vitamin comparison score is based on the number of vitamins by which one or the other food is richer. The "coverage" charts below show how much of the daily needs can be covered by 300 grams of the food.
| Contains more Vitamin EVitamin E | +∞% |
All nutrients comparison - raw data values
| Nutrient |  |
 |
DV% diff. |
| Saturated fat | 81.2g | 0g | 369% |
| Fats | 100g | 0g | 154% |
| Vitamin E | 19.1mg | 0mg | 127% |
| Calories | 884kcal | 34kcal | 43% |
| Monounsaturated fat | 11.4g | 0g | 29% |
| Polyunsaturated fat | 1.6g | 0g | 11% |
| Fructose | 3.7g | 5% | |
| Carbs | 0g | 8.76g | 3% |
| Iron | 0mg | 0.18mg | 2% |
| Copper | 0.018mg | 2% | |
| Manganese | 0.013mg | 1% | |
| Net carbs | 0g | 8.76g | N/A |
| Magnesium | 0mg | 1mg | 0% |
| Calcium | 0mg | 3mg | 0% |
| Potassium | 0mg | 1mg | 0% |
| Sugar | 0g | 8.9g | N/A |
| Zinc | 0mg | 0.05mg | 0% |
| Sodium | 0mg | 7mg | 0% |
| Selenium | 0µg | 0.1µg | 0% |
Macronutrient Comparison
Macronutrient breakdown side-by-side comparison
Protein:
0 g
Fats:
100 g
Carbs:
0 g
Water:
0 g
Other:
0 g
Protein:
0 g
Fats:
0 g
Carbs:
8.76 g
Water:
91.23 g
Other:
0.01 g
| Contains more FatsFats | +∞% |
| Contains more CarbsCarbs | +∞% |
| Contains more WaterWater | +∞% |
| Contains more OtherOther | +∞% |
~equal in
Protein
~0g


