Baby ruth vs. Milky Way — In-Depth Nutrition Comparison
Compare
What are the main differences between baby ruth and Milky Way?
- Baby ruth is richer in manganese, copper, vitamin B3, magnesium, and monounsaturated fat, yet Milky Way is richer in calcium.
- Baby ruth has 8 times more vitamin B3 than Milky Way. Baby ruth has 1.251mg of vitamin B3, while Milky Way has 0.154mg.
We used Candies, NESTLE, BABY RUTH Bar and Candies, MARS SNACKFOOD US, MILKY WAY Bar types in this comparison.
Infographic
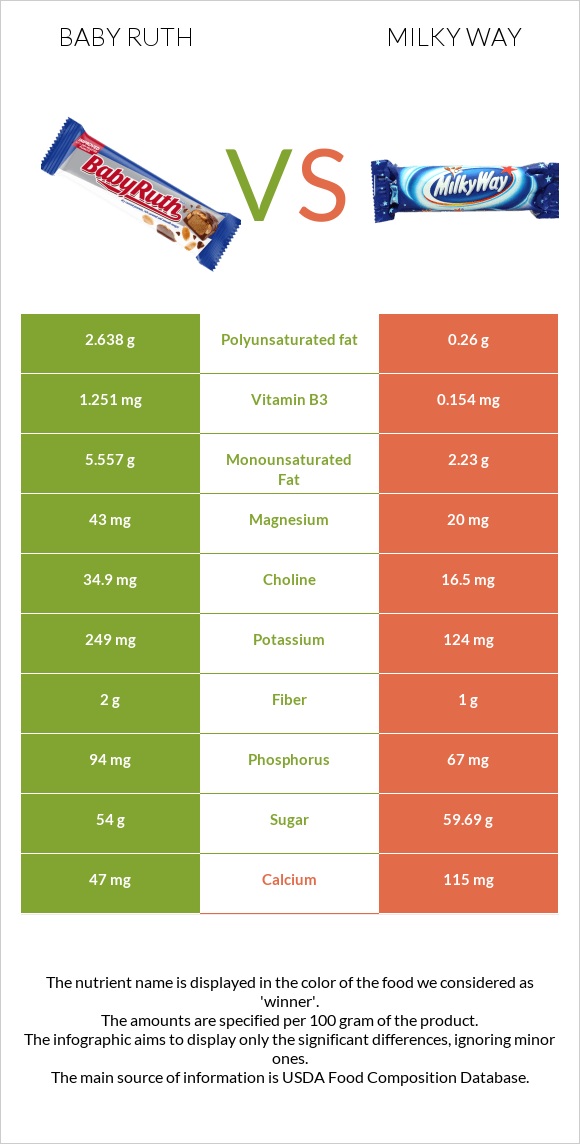
Infographic link
Mineral Comparison
Mineral comparison score is based on the number of minerals by which one or the other food is richer. The "coverage" charts below show how much of the daily needs can be covered by 300 grams of the food.
| Contains more MagnesiumMagnesium | +115% |
| Contains more PotassiumPotassium | +100.8% |
| Contains more IronIron | +28.6% |
| Contains more CopperCopper | +53.1% |
| Contains more PhosphorusPhosphorus | +40.3% |
| Contains more ManganeseManganese | +138.8% |
| Contains more SeleniumSelenium | +25% |
| Contains more CalciumCalcium | +144.7% |
| Contains less SodiumSodium | -27.4% |
Vitamin Comparison
Vitamin comparison score is based on the number of vitamins by which one or the other food is richer. The "coverage" charts below show how much of the daily needs can be covered by 300 grams of the food.
| Contains more Vitamin B1Vitamin B1 | +26.1% |
| Contains more Vitamin B2Vitamin B2 | +17.5% |
| Contains more Vitamin B3Vitamin B3 | +712.3% |
| Contains more Vitamin B5Vitamin B5 | +114.8% |
| Contains more Vitamin B6Vitamin B6 | +200% |
| Contains more FolateFolate | +200% |
| Contains more Vitamin CVitamin C | +∞% |
| Contains more Vitamin DVitamin D | +∞% |
| Contains more Vitamin AVitamin A | +∞% |
| Contains more Vitamin B12Vitamin B12 | +200% |
| Contains more Vitamin KVitamin K | +56.5% |
All nutrients comparison - raw data values
| Nutrient |  |
 |
DV% diff. |
| Polyunsaturated fat | 2.638g | 0.26g | 16% |
| Copper | 0.225mg | 0.147mg | 9% |
| Manganese | 0.351mg | 0.147mg | 9% |
| Monounsaturated fat | 5.557g | 2.23g | 8% |
| Fats | 21.6g | 17.23g | 7% |
| Calcium | 47mg | 115mg | 7% |
| Vitamin B3 | 1.251mg | 0.154mg | 7% |
| Magnesium | 43mg | 20mg | 5% |
| Vitamin B12 | 0.06µg | 0.18µg | 5% |
| Potassium | 249mg | 124mg | 4% |
| Fiber | 2g | 1g | 4% |
| Phosphorus | 94mg | 67mg | 4% |
| Vitamin B5 | 0.333mg | 0.155mg | 4% |
| Protein | 5.4g | 4.01g | 3% |
| Cholesterol | 0mg | 9mg | 3% |
| Sodium | 230mg | 167mg | 3% |
| Vitamin A | 0µg | 31µg | 3% |
| Choline | 34.9mg | 16.5mg | 3% |
| Carbs | 64.8g | 71.17g | 2% |
| Vitamin D* | 0 IU | 16 IU | 2% |
| Vitamin D | 0µg | 0.4µg | 2% |
| Iron | 0.63mg | 0.49mg | 2% |
| Vitamin B6 | 0.042mg | 0.014mg | 2% |
| Folate | 12µg | 4µg | 2% |
| Vitamin C | 0mg | 0.7mg | 1% |
| Selenium | 2.5µg | 2µg | 1% |
| Vitamin B1 | 0.058mg | 0.046mg | 1% |
| Vitamin B2 | 0.121mg | 0.103mg | 1% |
| Vitamin K | 2.3µg | 3.6µg | 1% |
| Caffeine | 4mg | 6mg | 1% |
| Calories | 459kcal | 456kcal | 0% |
| Protein per 100 calories | 1.2g | 0.88g | N/A |
| Calories per 10 g protein | 850kcal | 1137kcal | N/A |
| Weight per 100 calories | 22g | 22g | N/A |
| Unsaturated / Saturated Fat ratio | 0.68 | 0.21 | N/A |
| Net carbs | 62.8g | 70.17g | N/A |
| Sugar | 54g | 59.69g | N/A |
| Zinc | 0.72mg | 0.69mg | 0% |
| Vitamin E | 0.93mg | 0.89mg | 0% |
| Trans fat | 0.05g | 0.206g | N/A |
| Saturated fat | 12.1g | 12.016g | 0% |
Macronutrient Comparison
Macronutrient breakdown side-by-side comparison
| Contains more ProteinProtein | +34.7% |
| Contains more FatsFats | +25.4% |
~equal in
Carbs
~71.17g
~equal in
Water
~6.3g
~equal in
Other
~1.29g
Fat Type Comparison
Fat type breakdown side-by-side comparison
| Contains more Mono. FatMonounsaturated fat | +149.2% |
| Contains more Poly. FatPolyunsaturated fat | +914.6% |
~equal in
Saturated fat
~12.016g


