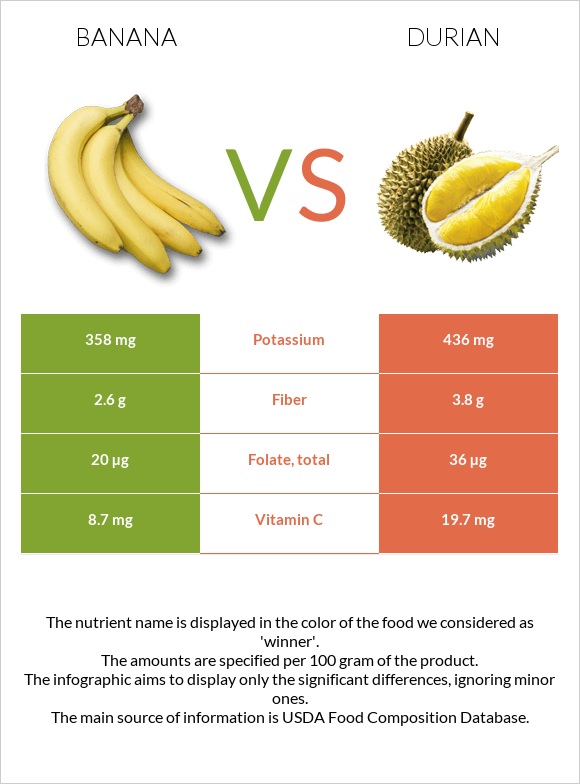
Important differences between bananas and durian Durian has more vitamin B1, copper, vitamin C, and vitamin B2 than bananas. Durian's daily need coverage for vitamin B1 is 29% more. The food varieties used in the comparison are Bananas, raw and Durian, raw or frozen .
Infographic
Mineral Comparison
Mineral comparison score is based on the number of minerals by which one or the other food is richer. The "coverage" charts below show how much of the daily needs can be covered by 300 grams of the food.
2
100 g
300 g
1 extra small (less than 6" long) - 81g 1 small (6" to 6-7/8" long) - 101g 1 medium (7" to 7-7/8" long) - 118g 1 NLEA serving - 126g 1 large (8" to 8-7/8" long) - 136g 1 cup, sliced - 150g 1 extra large (9" or longer) - 152g 1 cup, mashed - 225g
Magnesium
Magnesium
Calcium
Calcium
Potassium
Potassium
Iron
Iron
Copper
Copper
Zinc
Zinc
Phosphorus
Phosphorus
Sodium
Sodium
Manganese
Manganese
Selenium
Selenium
19%
1.5%
32%
9.8%
26%
4.1%
9.4%
0.13%
35%
5.5%
8
100 g
300 g
1 cup, chopped or diced - 243g 1 fruit - 602g
Magnesium
Magnesium
Calcium
Calcium
Potassium
Potassium
Iron
Iron
Copper
Copper
Zinc
Zinc
Phosphorus
Phosphorus
Sodium
Sodium
Manganese
Manganese
Selenium
Selenium
21%
1.8%
38%
16%
69%
7.6%
17%
0.26%
42%
0%
Vitamin Comparison
Vitamin comparison score is based on the number of vitamins by which one or the other food is richer. The "coverage" charts below show how much of the daily needs can be covered by 300 grams of the food.
5
100 g
300 g
1 extra small (less than 6" long) - 81g 1 small (6" to 6-7/8" long) - 101g 1 medium (7" to 7-7/8" long) - 118g 1 NLEA serving - 126g 1 large (8" to 8-7/8" long) - 136g 1 cup, sliced - 150g 1 extra large (9" or longer) - 152g 1 cup, mashed - 225g
Vitamin C
Vit. C
Vitamin D
Vit. D
Vitamin A
Vit. A
Vitamin E
Vit. E
Vitamin B1
Vit. B1
Vitamin B2
Vit. B2
Vitamin B3
Vit. B3
Vitamin B5
Vit. B5
Vitamin B6
Vit. B6
Vitamin B12
Vit. B12
Vitamin K
Vit. K
Folate
Folate
29%
0%
1%
2%
7.8%
17%
12%
20%
85%
0%
1.3%
15%
5
100 g
300 g
1 cup, chopped or diced - 243g 1 fruit - 602g
Vitamin C
Vit. C
Vitamin D
Vit. D
Vitamin A
Vit. A
Vitamin E
Vit. E
Vitamin B1
Vit. B1
Vitamin B2
Vit. B2
Vitamin B3
Vit. B3
Vitamin B5
Vit. B5
Vitamin B6
Vit. B6
Vitamin B12
Vit. B12
Vitamin K
Vit. K
Folate
Folate
66%
0%
0.67%
0%
94%
46%
20%
14%
73%
0%
0%
27%
All nutrients comparison - raw data values
Nutrient
DV% diff.
Vitamin B1
0.031mg
0.374mg
29%
Copper
0.078mg
0.207mg
14%
Vitamin C
8.7mg
19.7mg
12%
Vitamin B2
0.073mg
0.2mg
10%
Fats
0.33g
5.33g
8%
Fructose
4.85g
6%
Fiber
2.6g
3.8g
5%
Vitamin B6
0.367mg
0.316mg
4%
Folate
20µg
36µg
4%
Calories
89kcal
147kcal
3%
Vitamin B3
0.665mg
1.074mg
3%
Potassium
358mg
436mg
2%
Iron
0.26mg
0.43mg
2%
Starch
5.38g
2%
Phosphorus
22mg
39mg
2%
Manganese
0.27mg
0.325mg
2%
Selenium
1µg
2%
Vitamin B5
0.334mg
0.23mg
2%
Choline
9.8mg
2%
Protein
1.09g
1.47g
1%
Carbs
22.84g
27.09g
1%
Magnesium
27mg
30mg
1%
Zinc
0.15mg
0.28mg
1%
Vitamin E
0.1mg
1%
Saturated fat
0.112g
1%
Protein per 100 calories
1.2g
1g
N/A
Calories per 10 g protein
817kcal
1000kcal
N/A
Weight per 100 calories
112g
68g
N/A
Unsaturated / Saturated Fat ratio
0.94
N/A
Net carbs
20.24g
23.29g
N/A
Calcium
5mg
6mg
0%
Sugar
12.23g
N/A
Sodium
1mg
2mg
0%
Vitamin A
3µg
2µg
0%
Vitamin K
0.5µg
0%
Monounsaturated fat
0.032g
0%
Polyunsaturated fat
0.073g
0%
Tryptophan
0.009mg
0%
Threonine
0.028mg
0%
Isoleucine
0.028mg
0%
Leucine
0.068mg
0%
Lysine
0.05mg
0%
Methionine
0.008mg
0%
Phenylalanine
0.049mg
0%
Valine
0.047mg
0%
Histidine
0.077mg
0%
Macronutrient Comparison
Macronutrient breakdown side-by-side comparison
1
23%
75%
Protein:
1.09 g
Fats:
0.33 g
Carbs:
22.84 g
Water:
74.91 g
Other:
0.83 g
4
5%
27%
65%
Protein:
1.47 g
Fats:
5.33 g
Carbs:
27.09 g
Water:
64.99 g
Other:
1.12 g
Contains
more
Water Water
+15.3%
Contains
more
Protein Protein
+34.9%
Contains
more
Fats Fats
+1515.2%
Contains
more
Carbs Carbs
+18.6%
Contains
more
Other Other
+34.9%