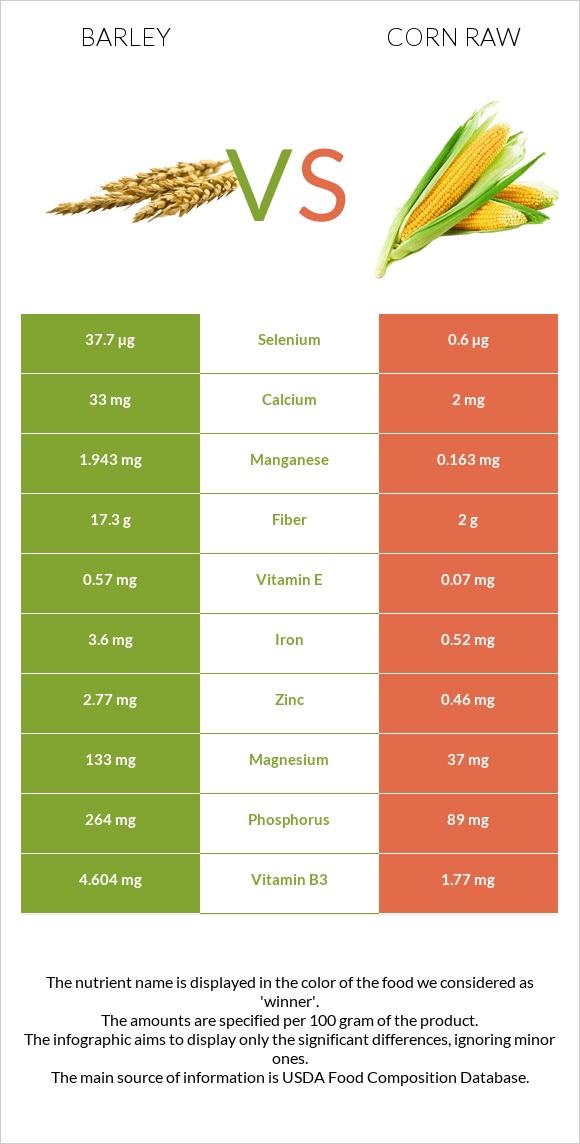
Differences between barley and corn raw Corn raw contains less manganese, selenium, fiber, copper, vitamin B1, iron, phosphorus, magnesium, zinc, and vitamin B3 than barley. Barley's daily need coverage for manganese is 77% higher. Corn raw contains 63 times less selenium than barley. Barley contains 37.7µg of selenium, while corn raw contains 0.6µg. Barley has a lower glycemic index. The glycemic index of barley is 28, while the glycemic index of corn raw is 52. The food types used in this comparison are Barley, hulled and Corn, sweet, yellow, raw .
Infographic
Mineral Comparison
Mineral comparison score is based on the number of minerals by which one or the other food is richer. The "coverage" charts below show how much of the daily needs can be covered by 300 grams of the food.
10
100 g
300 g
1 cup - 184g
Magnesium
Magnesium
Calcium
Calcium
Potassium
Potassium
Iron
Iron
Copper
Copper
Zinc
Zinc
Phosphorus
Phosphorus
Sodium
Sodium
Manganese
Manganese
Selenium
Selenium
95%
9.9%
40%
135%
166%
76%
113%
1.6%
253%
206%
0
100 g
300 g
1 ear, small (5-1/2" to 6-1/2" long) - 73g 1 ear, medium (6-3/4" to 7-1/2" long) yields - 102g 1 ear, large (7-3/4" to 9" long) yields - 143g 1 cup - 145g
Magnesium
Magnesium
Calcium
Calcium
Potassium
Potassium
Iron
Iron
Copper
Copper
Zinc
Zinc
Phosphorus
Phosphorus
Sodium
Sodium
Manganese
Manganese
Selenium
Selenium
26%
0.6%
24%
20%
18%
13%
38%
2%
21%
3.3%
Vitamin Comparison
Vitamin comparison score is based on the number of vitamins by which one or the other food is richer. The "coverage" charts below show how much of the daily needs can be covered by 300 grams of the food.
6
100 g
300 g
1 cup - 184g
Vitamin C
Vit. C
Vitamin D
Vit. D
Vitamin A
Vit. A
Vitamin E
Vit. E
Vitamin B1
Vit. B1
Vitamin B2
Vit. B2
Vitamin B3
Vit. B3
Vitamin B5
Vit. B5
Vitamin B6
Vit. B6
Vitamin B12
Vit. B12
Vitamin K
Vit. K
Folate
Folate
0%
0%
0.33%
11%
162%
66%
86%
17%
73%
0%
5.5%
14%
4
100 g
300 g
1 ear, small (5-1/2" to 6-1/2" long) - 73g 1 ear, medium (6-3/4" to 7-1/2" long) yields - 102g 1 ear, large (7-3/4" to 9" long) yields - 143g 1 cup - 145g
Vitamin C
Vit. C
Vitamin D
Vit. D
Vitamin A
Vit. A
Vitamin E
Vit. E
Vitamin B1
Vit. B1
Vitamin B2
Vit. B2
Vitamin B3
Vit. B3
Vitamin B5
Vit. B5
Vitamin B6
Vit. B6
Vitamin B12
Vit. B12
Vitamin K
Vit. K
Folate
Folate
23%
0%
3%
1.4%
39%
13%
33%
43%
21%
0%
0.75%
32%
All nutrients comparison - raw data values
Nutrient
DV% diff.
Manganese
1.943mg
0.163mg
77%
Selenium
37.7µg
0.6µg
67%
Fiber
17.3g
2g
61%
Copper
0.498mg
0.054mg
49%
Vitamin B1
0.646mg
0.155mg
41%
Iron
3.6mg
0.52mg
39%
Phosphorus
264mg
89mg
25%
Magnesium
133mg
37mg
23%
Zinc
2.77mg
0.46mg
21%
Protein
12.48g
3.27g
18%
Carbs
73.48g
18.7g
18%
Vitamin B2
0.285mg
0.055mg
18%
Vitamin B3
4.604mg
1.77mg
18%
Vitamin B6
0.318mg
0.093mg
17%
Calories
354kcal
86kcal
13%
Vitamin B5
0.282mg
0.717mg
9%
Vitamin C
0mg
6.8mg
8%
Folate
19µg
42µg
6%
Potassium
452mg
270mg
5%
Choline
23mg
4%
Polyunsaturated fat
1.108g
0.487g
4%
Calcium
33mg
2mg
3%
Vitamin E
0.57mg
0.07mg
3%
Starch
5.7g
2%
Vitamin K
2.2µg
0.3µg
2%
Fructose
1.94g
2%
Fats
2.3g
1.35g
1%
Vitamin A
1µg
9µg
1%
Saturated fat
0.482g
0.325g
1%
Protein per 100 calories
3.5g
3.8g
N/A
Calories per 10 g protein
284kcal
263kcal
N/A
Weight per 100 calories
28g
116g
N/A
Unsaturated / Saturated Fat ratio
2.9
2.8
N/A
Net carbs
56.18g
16.7g
N/A
Sugar
0.8g
6.26g
N/A
Sodium
12mg
15mg
0%
Monounsaturated fat
0.295g
0.432g
0%
Tryptophan
0.208mg
0.023mg
0%
Threonine
0.424mg
0.129mg
0%
Isoleucine
0.456mg
0.129mg
0%
Leucine
0.848mg
0.348mg
0%
Lysine
0.465mg
0.137mg
0%
Methionine
0.24mg
0.067mg
0%
Phenylalanine
0.7mg
0.15mg
0%
Valine
0.612mg
0.185mg
0%
Histidine
0.281mg
0.089mg
0%
Omega-3 - ALA
0.014g
N/A
Omega-6 - Linoleic acid
0.468g
N/A
Macronutrient Comparison
Macronutrient breakdown side-by-side comparison
4
12%
2%
73%
9%
2%
Protein:
12.48 g
Fats:
2.3 g
Carbs:
73.48 g
Water:
9.44 g
Other:
2.3 g
1
3%
19%
76%
Protein:
3.27 g
Fats:
1.35 g
Carbs:
18.7 g
Water:
76.05 g
Other:
0.63 g
Contains
more
Protein Protein
+281.7%
Contains
more
Fats Fats
+70.4%
Contains
more
Carbs Carbs
+292.9%
Contains
more
Other Other
+265.1%
Contains
more
Water Water
+705.6%
Fat Type Comparison
Fat type breakdown side-by-side comparison
1
26%
16%
59%
Saturated fat:
Sat. Fat
0.482 g
Monounsaturated fat:
Mono. Fat
0.295 g
Polyunsaturated fat:
Poly. Fat
1.108 g
2
26%
35%
39%
Saturated fat:
Sat. Fat
0.325 g
Monounsaturated fat:
Mono. Fat
0.432 g
Polyunsaturated fat:
Poly. Fat
0.487 g
Contains
more
Poly. Fat Polyunsaturated fat
+127.5%
Contains
less
Sat. Fat Saturated fat
-32.6%
Contains
more
Mono. Fat Monounsaturated fat
+46.4%