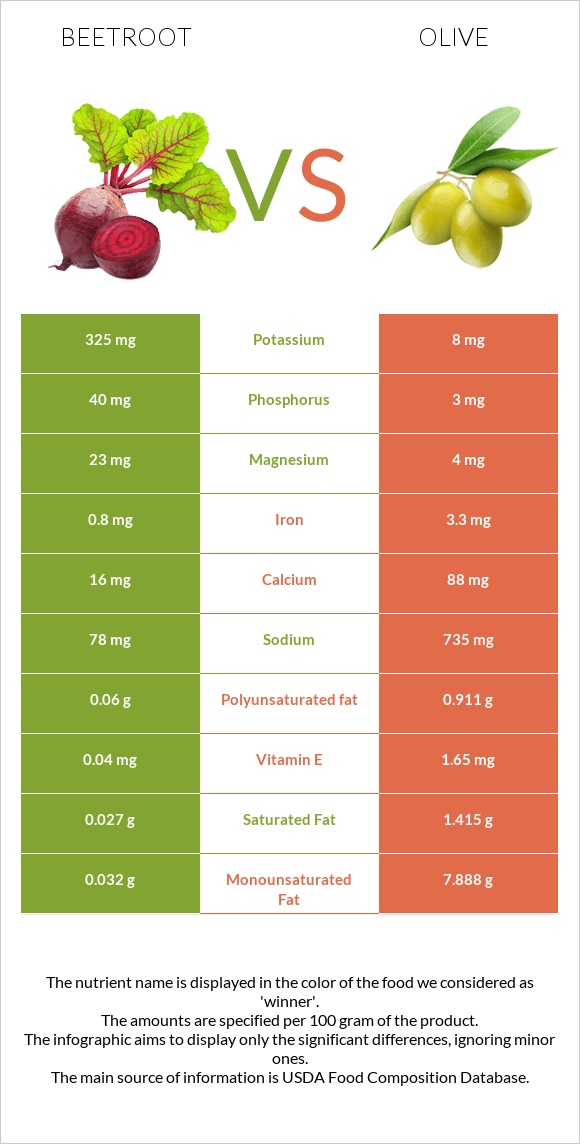
Summary of differences between beetroot and olive Beetroot has more folate, manganese, and potassium, while olive has more iron, copper, vitamin E, vitamin A, and calcium. Olive covers your daily need for iron, 31% more than beetroot. The amount of sodium in beetroot is lower. These are the specific foods used in this comparison Beets, raw and Olives, ripe, canned (small-extra large) .
Infographic
Mineral Comparison
Mineral comparison score is based on the number of minerals by which one or the other food is richer. The "coverage" charts below show how much of the daily needs can be covered by 300 grams of the food.
6
100 g
300 g
1 beet (2" dia) - 82g 1 cup - 136g
Magnesium
Magnesium
Calcium
Calcium
Potassium
Potassium
Iron
Iron
Copper
Copper
Zinc
Zinc
Phosphorus
Phosphorus
Sodium
Sodium
Manganese
Manganese
Selenium
Selenium
16%
4.8%
29%
30%
25%
9.5%
17%
10%
43%
3.8%
4
100 g
300 g
1 small - 3.2g 1 large - 4.4g 1 tbsp - 8.4g
Magnesium
Magnesium
Calcium
Calcium
Potassium
Potassium
Iron
Iron
Copper
Copper
Zinc
Zinc
Phosphorus
Phosphorus
Sodium
Sodium
Manganese
Manganese
Selenium
Selenium
2.9%
26%
0.71%
124%
84%
6%
1.3%
96%
2.6%
4.9%
Vitamin Comparison
Vitamin comparison score is based on the number of vitamins by which one or the other food is richer. The "coverage" charts below show how much of the daily needs can be covered by 300 grams of the food.
7
100 g
300 g
1 beet (2" dia) - 82g 1 cup - 136g
Vitamin C
Vit. C
Vitamin D
Vit. D
Vitamin A
Vit. A
Vitamin E
Vit. E
Vitamin B1
Vit. B1
Vitamin B2
Vit. B2
Vitamin B3
Vit. B3
Vitamin B5
Vit. B5
Vitamin B6
Vit. B6
Vitamin B12
Vit. B12
Vitamin K
Vit. K
Folate
Folate
16%
0%
0.67%
0.8%
7.8%
9.2%
6.3%
9.3%
15%
0%
0.5%
82%
3
100 g
300 g
1 small - 3.2g 1 large - 4.4g 1 tbsp - 8.4g
Vitamin C
Vit. C
Vitamin D
Vit. D
Vitamin A
Vit. A
Vitamin E
Vit. E
Vitamin B1
Vit. B1
Vitamin B2
Vit. B2
Vitamin B3
Vit. B3
Vitamin B5
Vit. B5
Vitamin B6
Vit. B6
Vitamin B12
Vit. B12
Vitamin K
Vit. K
Folate
Folate
3%
0%
6.7%
33%
0.75%
0%
0.69%
0.9%
2.1%
0%
3.5%
0%
All nutrients comparison - raw data values
Nutrient
DV% diff.
Iron
0.8mg
3.3mg
31%
Sodium
78mg
735mg
29%
Folate
109µg
0µg
27%
Copper
0.075mg
0.251mg
20%
Monounsaturated fat
0.032g
7.888g
20%
Fats
0.17g
10.68g
16%
Manganese
0.329mg
0.02mg
13%
Vitamin E
0.04mg
1.65mg
11%
Potassium
325mg
8mg
9%
Calcium
16mg
88mg
7%
Saturated fat
0.027g
1.415g
6%
Polyunsaturated fat
0.06g
0.911g
6%
Magnesium
23mg
4mg
5%
Phosphorus
40mg
3mg
5%
Calories
43kcal
115kcal
4%
Vitamin C
4.9mg
0.9mg
4%
Vitamin B6
0.067mg
0.009mg
4%
Vitamin B2
0.04mg
0mg
3%
Vitamin B5
0.155mg
0.015mg
3%
Protein
1.61g
0.84g
2%
Fiber
2.8g
3.2g
2%
Vitamin A
2µg
20µg
2%
Vitamin B1
0.031mg
0.003mg
2%
Vitamin B3
0.334mg
0.037mg
2%
Carbs
9.56g
6.26g
1%
Zinc
0.35mg
0.22mg
1%
Vitamin K
0.2µg
1.4µg
1%
Choline
6mg
10.3mg
1%
Protein per 100 calories
3.7g
0.73g
N/A
Calories per 10 g protein
267kcal
1369kcal
N/A
Weight per 100 calories
233g
87g
N/A
Unsaturated / Saturated Fat ratio
3.4
6.2
N/A
Net carbs
6.76g
3.06g
N/A
Sugar
6.76g
0g
N/A
Selenium
0.7µg
0.9µg
0%
Tryptophan
0.019mg
0%
Threonine
0.047mg
0.026mg
0%
Isoleucine
0.048mg
0.031mg
0%
Leucine
0.068mg
0.05mg
0%
Lysine
0.058mg
0.032mg
0%
Methionine
0.018mg
0.012mg
0%
Phenylalanine
0.046mg
0.029mg
0%
Valine
0.056mg
0.038mg
0%
Histidine
0.021mg
0.023mg
0%
Macronutrient Comparison
Macronutrient breakdown side-by-side comparison
3
10%
88%
Protein:
1.61 g
Fats:
0.17 g
Carbs:
9.56 g
Water:
87.58 g
Other:
1.08 g
2
11%
6%
80%
2%
Protein:
0.84 g
Fats:
10.68 g
Carbs:
6.26 g
Water:
79.99 g
Other:
2.23 g
Contains
more
Protein Protein
+91.7%
Contains
more
Carbs Carbs
+52.7%
Contains
more
Fats Fats
+6182.4%
Contains
more
Other Other
+106.5%
Fat Type Comparison
Fat type breakdown side-by-side comparison
1
23%
27%
50%
Saturated fat:
Sat. Fat
0.027 g
Monounsaturated fat:
Mono. Fat
0.032 g
Polyunsaturated fat:
Poly. Fat
0.06 g
2
14%
77%
9%
Saturated fat:
Sat. Fat
1.415 g
Monounsaturated fat:
Mono. Fat
7.888 g
Polyunsaturated fat:
Poly. Fat
0.911 g
Contains
less
Sat. Fat Saturated fat
-98.1%
Contains
more
Mono. Fat Monounsaturated fat
+24550%
Contains
more
Poly. Fat Polyunsaturated fat
+1418.3%