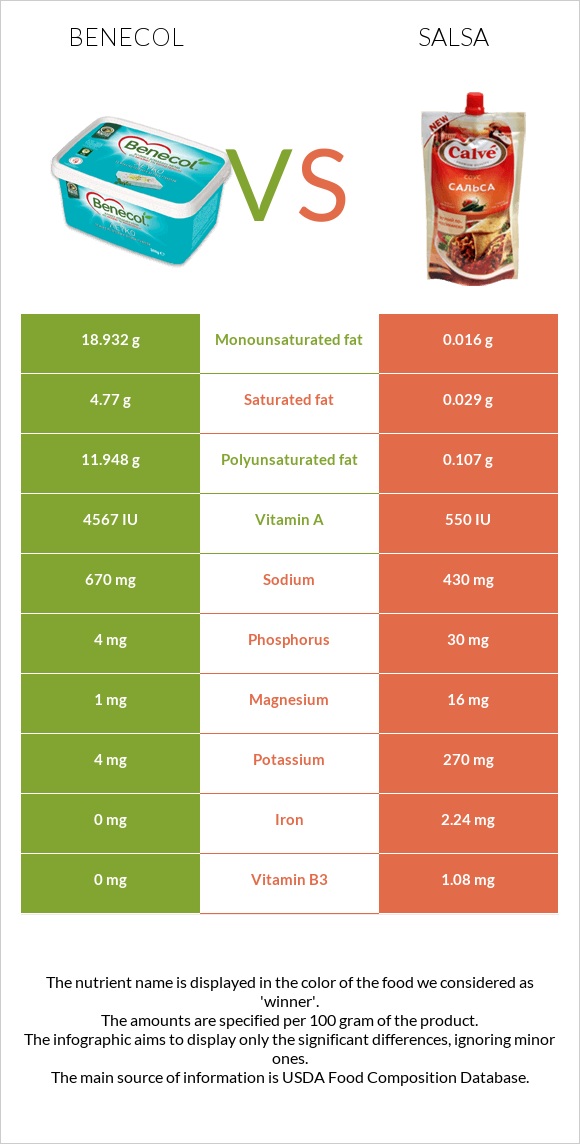
A recap on the differences between benecol and salsa Benecol is higher in vitamin A, yet salsa is higher in iron, vitamin B6, copper, potassium, and vitamin B3. Benecol covers your daily vitamin A needs 80% more than salsa. Benecol contains 164 times more saturated fat than salsa. While benecol contains 4.77g of saturated fat, salsa contains only 0.029g. Food varieties used in this article are Margarine-like spread, BENECOL Light Spread and USDA Commodity, salsa .
Infographic
Mineral Comparison
Mineral comparison score is based on the number of minerals by which one or the other food is richer. The "coverage" charts below show how much of the daily needs can be covered by 300 grams of the food.
0
100 g
300 g
1 tablespoon (1 NLEA serving) - 14g
Magnesium
Magnesium
Calcium
Calcium
Potassium
Potassium
Iron
Iron
Copper
Copper
Zinc
Zinc
Phosphorus
Phosphorus
Sodium
Sodium
Manganese
Manganese
Selenium
Selenium
0.71%
1.2%
0.35%
0%
0%
0%
1.7%
87%
0%
0%
9
100 g
300 g
Magnesium
Magnesium
Calcium
Calcium
Potassium
Potassium
Iron
Iron
Copper
Copper
Zinc
Zinc
Phosphorus
Phosphorus
Sodium
Sodium
Manganese
Manganese
Selenium
Selenium
11%
3.6%
24%
84%
32%
4.6%
13%
56%
0%
2.2%
Vitamin Comparison
Vitamin comparison score is based on the number of vitamins by which one or the other food is richer. The "coverage" charts below show how much of the daily needs can be covered by 300 grams of the food.
3
100 g
300 g
1 tablespoon (1 NLEA serving) - 14g
Vitamin C
Vit. C
Vitamin D
Vit. D
Vitamin A
Vit. A
Vitamin E
Vit. E
Vitamin B1
Vit. B1
Vitamin B2
Vit. B2
Vitamin B3
Vit. B3
Vitamin B5
Vit. B5
Vitamin B6
Vit. B6
Vitamin B12
Vit. B12
Vitamin K
Vit. K
Folate
Folate
0%
0%
457%
744%
3%
0%
0%
0%
0%
0%
141%
0%
6
100 g
300 g
Vitamin C
Vit. C
Vitamin D
Vit. D
Vitamin A
Vit. A
Vitamin E
Vit. E
Vitamin B1
Vit. B1
Vitamin B2
Vit. B2
Vitamin B3
Vit. B3
Vitamin B5
Vit. B5
Vitamin B6
Vit. B6
Vitamin B12
Vit. B12
Vitamin K
Vit. K
Folate
Folate
13%
0%
9.3%
0%
13%
6.9%
20%
0%
34%
0%
0%
14%
All nutrients comparison - raw data values
Nutrient
DV% diff.
Vitamin E
37.22mg
248%
Vitamin A
1370µg
28µg
149%
Polyunsaturated fat
11.948g
0.107g
79%
Fats
38.71g
0.2g
59%
Vitamin K
56.5µg
47%
Monounsaturated fat
18.932g
0.016g
47%
Iron
0mg
2.24mg
28%
Saturated fat
4.77g
0.029g
22%
Calories
357kcal
36kcal
16%
Copper
0mg
0.096mg
11%
Vitamin B6
0mg
0.149mg
11%
Sodium
670mg
430mg
10%
Potassium
4mg
270mg
8%
Vitamin B3
0mg
1.08mg
7%
Fiber
1.4g
6%
Folate
19µg
5%
Vitamin C
4mg
4%
Magnesium
1mg
16mg
4%
Phosphorus
4mg
30mg
4%
Protein
0g
1.5g
3%
Vitamin B1
0.012mg
0.05mg
3%
Zinc
0mg
0.17mg
2%
Vitamin B2
0mg
0.03mg
2%
Calcium
4mg
12mg
1%
Selenium
0.4µg
1%
Protein per 100 calories
0g
4.2g
N/A
Calories per 10 g protein
240kcal
N/A
Weight per 100 calories
28g
278g
N/A
Unsaturated / Saturated Fat ratio
6.5
4.2
N/A
Net carbs
5.71g
5.6g
N/A
Carbs
5.71g
7g
0%
Trans fat
2.214g
N/A
Omega-3 - ALA
1.976g
N/A
Omega-6 - Eicosadienoic acid
0.037g
N/A
Omega-6 - Linoleic acid
9.557g
N/A
Macronutrient Comparison
Macronutrient breakdown side-by-side comparison
2
39%
6%
54%
2%
Protein:
0 g
Fats:
38.71 g
Carbs:
5.71 g
Water:
53.73 g
Other:
1.85 g
3
7%
90%
Protein:
1.5 g
Fats:
0.2 g
Carbs:
7 g
Water:
89.7 g
Other:
1.6 g
Contains
more
Fats Fats
+19255%
Contains
more
Other Other
+15.6%
Contains
more
Protein Protein
+∞%
Contains
more
Carbs Carbs
+22.6%
Contains
more
Water Water
+66.9%
Fat Type Comparison
Fat type breakdown side-by-side comparison
2
13%
53%
34%
Saturated fat:
Sat. Fat
4.77 g
Monounsaturated fat:
Mono. Fat
18.932 g
Polyunsaturated fat:
Poly. Fat
11.948 g
1
19%
11%
70%
Saturated fat:
Sat. Fat
0.029 g
Monounsaturated fat:
Mono. Fat
0.016 g
Polyunsaturated fat:
Poly. Fat
0.107 g
Contains
more
Mono. Fat Monounsaturated fat
+118225%
Contains
more
Poly. Fat Polyunsaturated fat
+11066.4%
Contains
less
Sat. Fat Saturated fat
-99.4%