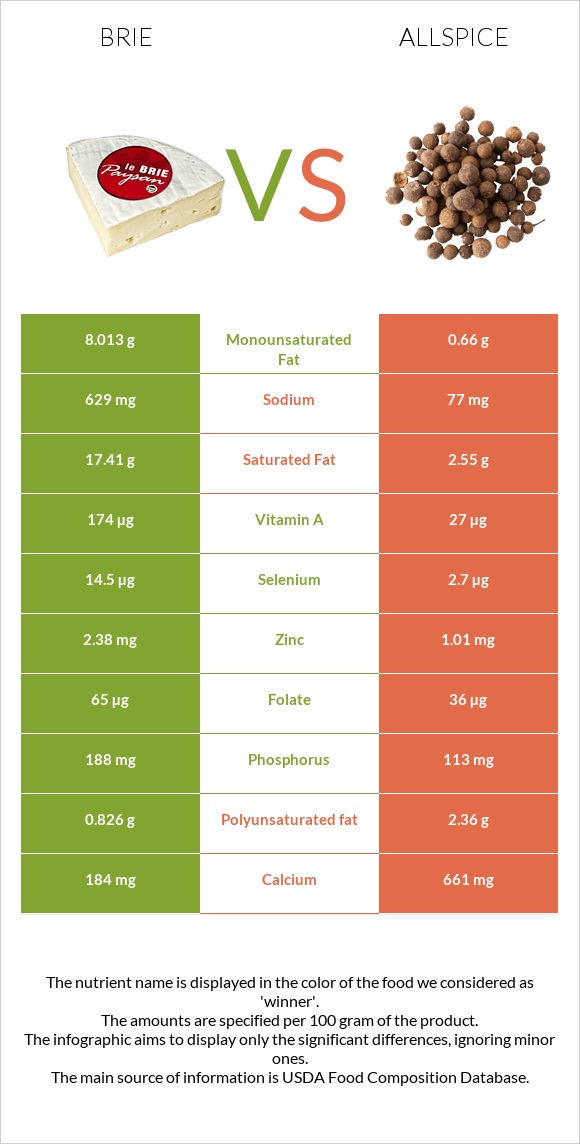
What are the differences between brie and allspice? Brie is higher in vitamin B12 and vitamin B2, yet allspice is higher in manganese, fiber, iron, copper, calcium, and vitamin C. Allspice's daily need coverage for manganese is 126% more. The amount of cholesterol in allspice is lower. The glycemic index of brie is lower. We used Cheese, brie and Spices, allspice, ground types in this article.
Infographic
Mineral Comparison
Mineral comparison score is based on the number of minerals by which one or the other food is richer. The "coverage" charts below show how much of the daily needs can be covered by 300 grams of the food.
3
100 g
300 g
1 cubic inch - 17g 1 oz - 28.35g 1 package (4.5 oz) - 128g 1 cup, sliced - 144g 1 cup, melted - 240g
Magnesium
Magnesium
Calcium
Calcium
Potassium
Potassium
Iron
Iron
Copper
Copper
Zinc
Zinc
Phosphorus
Phosphorus
Sodium
Sodium
Manganese
Manganese
Selenium
Selenium
14%
55%
13%
19%
6.3%
65%
81%
82%
4.4%
79%
7
100 g
300 g
0.25 tsp - 0.5g 1 tsp - 1.9g 1 tbsp - 6g
Magnesium
Magnesium
Calcium
Calcium
Potassium
Potassium
Iron
Iron
Copper
Copper
Zinc
Zinc
Phosphorus
Phosphorus
Sodium
Sodium
Manganese
Manganese
Selenium
Selenium
96%
198%
92%
265%
184%
28%
48%
10%
384%
15%
Vitamin Comparison
Vitamin comparison score is based on the number of vitamins by which one or the other food is richer. The "coverage" charts below show how much of the daily needs can be covered by 300 grams of the food.
9
100 g
300 g
1 cubic inch - 17g 1 oz - 28.35g 1 package (4.5 oz) - 128g 1 cup, sliced - 144g 1 cup, melted - 240g
Vitamin C
Vit. C
Vitamin D
Vit. D
Vitamin A
Vit. A
Vitamin E
Vit. E
Vitamin B1
Vit. B1
Vitamin B2
Vit. B2
Vitamin B3
Vit. B3
Vitamin B5
Vit. B5
Vitamin B6
Vit. B6
Vitamin B12
Vit. B12
Vitamin K
Vit. K
Folate
Folate
0%
7.5%
58%
4.8%
18%
120%
7.1%
41%
54%
206%
5.8%
49%
3
100 g
300 g
0.25 tsp - 0.5g 1 tsp - 1.9g 1 tbsp - 6g
Vitamin C
Vit. C
Vitamin D
Vit. D
Vitamin A
Vit. A
Vitamin E
Vit. E
Vitamin B1
Vit. B1
Vitamin B2
Vit. B2
Vitamin B3
Vit. B3
Vitamin B5
Vit. B5
Vitamin B6
Vit. B6
Vitamin B12
Vit. B12
Vitamin K
Vit. K
Folate
Folate
131%
0%
9%
0%
25%
15%
54%
0%
48%
0%
0%
27%
All nutrients comparison - raw data values
Nutrient
DV% diff.
Manganese
0.034mg
2.943mg
126%
Fiber
0g
21.6g
86%
Iron
0.5mg
7.06mg
82%
Vitamin B12
1.65µg
0µg
69%
Saturated fat
17.41g
2.55g
68%
Copper
0.019mg
0.553mg
59%
Calcium
184mg
661mg
48%
Vitamin C
0mg
39.2mg
44%
Vitamin B2
0.52mg
0.063mg
35%
Cholesterol
100mg
0mg
33%
Protein
20.75g
6.09g
29%
Fats
27.68g
8.69g
29%
Magnesium
20mg
135mg
27%
Potassium
152mg
1044mg
26%
Carbs
0.45g
72.12g
24%
Sodium
629mg
77mg
24%
Selenium
14.5µg
2.7µg
21%
Monounsaturated fat
8.013g
0.66g
18%
Vitamin A
174µg
27µg
16%
Vitamin B3
0.38mg
2.86mg
16%
Vitamin B5
0.69mg
14%
Zinc
2.38mg
1.01mg
12%
Phosphorus
188mg
113mg
11%
Polyunsaturated fat
0.826g
2.36g
10%
Folate
65µg
36µg
7%
Calories
334kcal
263kcal
4%
Vitamin D*
20 IU
0 IU
3%
Vitamin D
0.5µg
0µg
3%
Vitamin B1
0.07mg
0.101mg
3%
Choline
15.4mg
3%
Vitamin E
0.24mg
2%
Vitamin B6
0.235mg
0.21mg
2%
Vitamin K
2.3µg
2%
Protein per 100 calories
6.2g
2.3g
N/A
Calories per 10 g protein
161kcal
432kcal
N/A
Weight per 100 calories
30g
38g
N/A
Unsaturated / Saturated Fat ratio
0.51
1.2
N/A
Net carbs
0.45g
50.52g
N/A
Sugar
0.45g
N/A
Tryptophan
0.322mg
0%
Threonine
0.751mg
0%
Isoleucine
1.015mg
0%
Leucine
1.929mg
0%
Lysine
1.851mg
0%
Methionine
0.592mg
0%
Phenylalanine
1.158mg
0%
Valine
1.34mg
0%
Histidine
0.716mg
0%
Macronutrient Comparison
Macronutrient breakdown side-by-side comparison
3
21%
28%
48%
3%
Protein:
20.75 g
Fats:
27.68 g
Carbs:
0.45 g
Water:
48.42 g
Other:
2.7 g
2
6%
9%
72%
8%
5%
Protein:
6.09 g
Fats:
8.69 g
Carbs:
72.12 g
Water:
8.46 g
Other:
4.64 g
Contains
more
Protein Protein
+240.7%
Contains
more
Fats Fats
+218.5%
Contains
more
Water Water
+472.3%
Contains
more
Carbs Carbs
+15926.7%
Contains
more
Other Other
+71.9%
Fat Type Comparison
Fat type breakdown side-by-side comparison
1
66%
31%
3%
Saturated fat:
Sat. Fat
17.41 g
Monounsaturated fat:
Mono. Fat
8.013 g
Polyunsaturated fat:
Poly. Fat
0.826 g
2
46%
12%
42%
Saturated fat:
Sat. Fat
2.55 g
Monounsaturated fat:
Mono. Fat
0.66 g
Polyunsaturated fat:
Poly. Fat
2.36 g
Contains
more
Mono. Fat Monounsaturated fat
+1114.1%
Contains
less
Sat. Fat Saturated fat
-85.4%
Contains
more
Poly. Fat Polyunsaturated fat
+185.7%