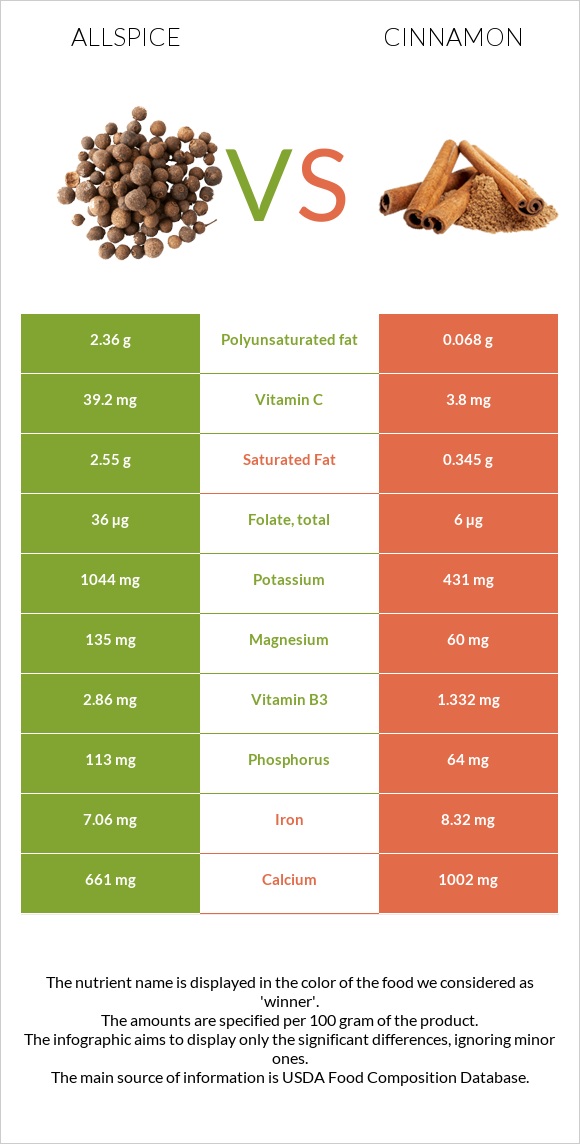
Differences between allspice and cinnamon Allspice is higher in vitamin C, copper, potassium, magnesium, and vitamin B3; however, cinnamon is richer in manganese, fiber, calcium, and iron. Cinnamon's daily need coverage for manganese is 631% higher. Allspice has 10 times more vitamin C than cinnamon. While allspice has 39.2mg of vitamin C, cinnamon has only 3.8mg. Cinnamon has less saturated fat. The food types used in this comparison are Spices, allspice, ground and Spices, cinnamon, ground .
Infographic
Mineral Comparison
Mineral comparison score is based on the number of minerals by which one or the other food is richer. The "coverage" charts below show how much of the daily needs can be covered by 300 grams of the food.
4
100 g
300 g
0.25 tsp - 0.5g 1 tsp - 1.9g 1 tbsp - 6g
Magnesium
Magnesium
Calcium
Calcium
Potassium
Potassium
Iron
Iron
Copper
Copper
Zinc
Zinc
Phosphorus
Phosphorus
Sodium
Sodium
Manganese
Manganese
Selenium
Selenium
96%
198%
92%
265%
184%
28%
48%
10%
384%
15%
6
100 g
300 g
0.25 tsp - 0.5g 1 tbsp - 7.8g
Magnesium
Magnesium
Calcium
Calcium
Potassium
Potassium
Iron
Iron
Copper
Copper
Zinc
Zinc
Phosphorus
Phosphorus
Sodium
Sodium
Manganese
Manganese
Selenium
Selenium
43%
301%
38%
312%
113%
50%
27%
1.3%
2278%
17%
Vitamin Comparison
Vitamin comparison score is based on the number of vitamins by which one or the other food is richer. The "coverage" charts below show how much of the daily needs can be covered by 300 grams of the food.
7
100 g
300 g
0.25 tsp - 0.5g 1 tsp - 1.9g 1 tbsp - 6g
Vitamin C
Vit. C
Vitamin D
Vit. D
Vitamin A
Vit. A
Vitamin E
Vit. E
Vitamin B1
Vit. B1
Vitamin B2
Vit. B2
Vitamin B3
Vit. B3
Vitamin B5
Vit. B5
Vitamin B6
Vit. B6
Vitamin B12
Vit. B12
Vitamin K
Vit. K
Folate
Folate
131%
0%
9%
0%
25%
15%
54%
0%
48%
0%
0%
27%
3
100 g
300 g
0.25 tsp - 0.5g 1 tbsp - 7.8g
Vitamin C
Vit. C
Vitamin D
Vit. D
Vitamin A
Vit. A
Vitamin E
Vit. E
Vitamin B1
Vit. B1
Vitamin B2
Vit. B2
Vitamin B3
Vit. B3
Vitamin B5
Vit. B5
Vitamin B6
Vit. B6
Vitamin B12
Vit. B12
Vitamin K
Vit. K
Folate
Folate
13%
0%
5%
46%
5.5%
9.5%
25%
21%
36%
0%
78%
4.5%
All nutrients comparison - raw data values
Nutrient
DV% diff.
Manganese
2.943mg
17.466mg
631%
Fiber
21.6g
53.1g
126%
Vitamin C
39.2mg
3.8mg
39%
Calcium
661mg
1002mg
34%
Vitamin K
31.2µg
26%
Copper
0.553mg
0.339mg
24%
Magnesium
135mg
60mg
18%
Potassium
1044mg
431mg
18%
Iron
7.06mg
8.32mg
16%
Vitamin E
2.32mg
15%
Polyunsaturated fat
2.36g
0.068g
15%
Fats
8.69g
1.24g
11%
Vitamin B3
2.86mg
1.332mg
10%
Saturated fat
2.55g
0.345g
10%
Folate
36µg
6µg
8%
Zinc
1.01mg
1.83mg
7%
Phosphorus
113mg
64mg
7%
Vitamin B1
0.101mg
0.022mg
7%
Vitamin B5
0.358mg
7%
Protein
6.09g
3.99g
4%
Vitamin B6
0.21mg
0.158mg
4%
Carbs
72.12g
80.59g
3%
Sodium
77mg
10mg
3%
Vitamin B2
0.063mg
0.041mg
2%
Choline
11mg
2%
Calories
263kcal
247kcal
1%
Vitamin A
27µg
15µg
1%
Selenium
2.7µg
3.1µg
1%
Monounsaturated fat
0.66g
0.246g
1%
Fructose
1.11g
1%
Protein per 100 calories
2.3g
1.6g
N/A
Calories per 10 g protein
432kcal
619kcal
N/A
Weight per 100 calories
38g
40g
N/A
Unsaturated / Saturated Fat ratio
1.2
0.91
N/A
Net carbs
50.52g
27.49g
N/A
Sugar
2.17g
N/A
Tryptophan
0.049mg
0%
Threonine
0.136mg
0%
Isoleucine
0.146mg
0%
Leucine
0.253mg
0%
Lysine
0.243mg
0%
Methionine
0.078mg
0%
Phenylalanine
0.146mg
0%
Valine
0.224mg
0%
Histidine
0.117mg
0%
Omega-3 - ALA
0.011g
N/A
Macronutrient Comparison
Macronutrient breakdown side-by-side comparison
3
6%
9%
72%
8%
5%
Protein:
6.09 g
Fats:
8.69 g
Carbs:
72.12 g
Water:
8.46 g
Other:
4.64 g
2
4%
81%
11%
4%
Protein:
3.99 g
Fats:
1.24 g
Carbs:
80.59 g
Water:
10.58 g
Other:
3.6 g
Contains
more
Protein Protein
+52.6%
Contains
more
Fats Fats
+600.8%
Contains
more
Other Other
+28.9%
Contains
more
Carbs Carbs
+11.7%
Contains
more
Water Water
+25.1%
Fat Type Comparison
Fat type breakdown side-by-side comparison
2
46%
12%
42%
Saturated fat:
Sat. Fat
2.55 g
Monounsaturated fat:
Mono. Fat
0.66 g
Polyunsaturated fat:
Poly. Fat
2.36 g
1
52%
37%
10%
Saturated fat:
Sat. Fat
0.345 g
Monounsaturated fat:
Mono. Fat
0.246 g
Polyunsaturated fat:
Poly. Fat
0.068 g
Contains
more
Mono. Fat Monounsaturated fat
+168.3%
Contains
more
Poly. Fat Polyunsaturated fat
+3370.6%
Contains
less
Sat. Fat Saturated fat
-86.5%