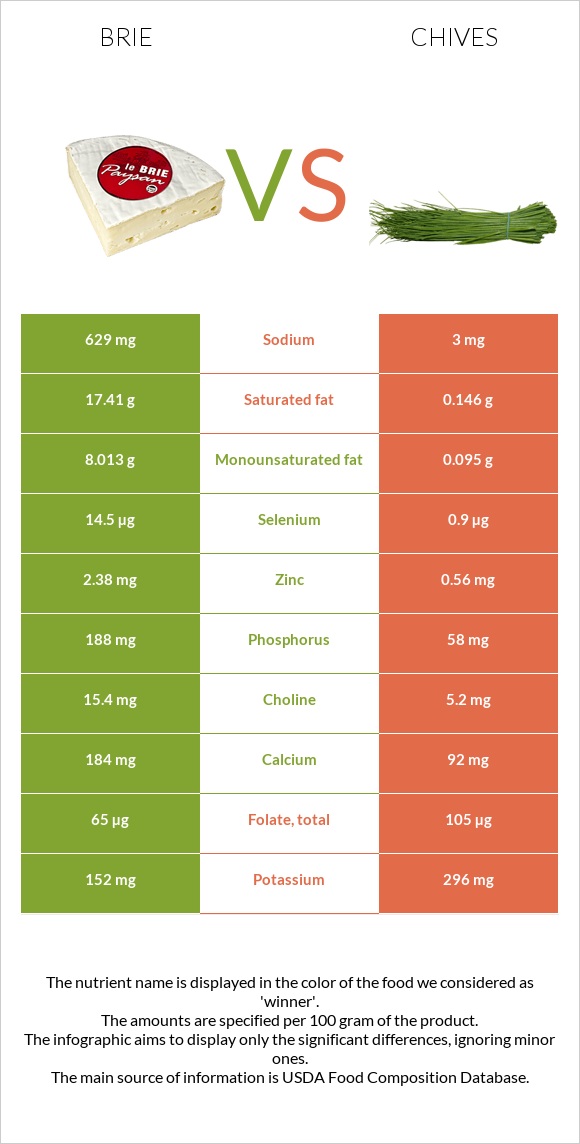
Important differences between brie and chives Brie has more vitamin B12, vitamin B2, selenium, and phosphorus; however, chives have more vitamin K, vitamin A, and vitamin C. Chives' daily need coverage for vitamin K is 175% more. Chives are lower in cholesterol. Chives have a higher glycemic index than brie. The food varieties used in the comparison are Cheese, brie and Chives, raw .
Infographic
Mineral Comparison
Mineral comparison score is based on the number of minerals by which one or the other food is richer. The "coverage" charts below show how much of the daily needs can be covered by 300 grams of the food.
4
100 g
300 g
1 cubic inch - 17g 1 oz - 28.35g 1 package (4.5 oz) - 128g 1 cup, sliced - 144g 1 cup, melted - 240g
Magnesium
Magnesium
Calcium
Calcium
Potassium
Potassium
Iron
Iron
Copper
Copper
Zinc
Zinc
Phosphorus
Phosphorus
Sodium
Sodium
Manganese
Manganese
Selenium
Selenium
14%
55%
13%
19%
6.3%
65%
81%
82%
4.4%
79%
6
100 g
300 g
1 tsp chopped - 1g 1 tbsp chopped - 3g
Magnesium
Magnesium
Calcium
Calcium
Potassium
Potassium
Iron
Iron
Copper
Copper
Zinc
Zinc
Phosphorus
Phosphorus
Sodium
Sodium
Manganese
Manganese
Selenium
Selenium
30%
28%
26%
60%
52%
15%
25%
0.39%
49%
4.9%
Vitamin Comparison
Vitamin comparison score is based on the number of vitamins by which one or the other food is richer. The "coverage" charts below show how much of the daily needs can be covered by 300 grams of the food.
6
100 g
300 g
1 cubic inch - 17g 1 oz - 28.35g 1 package (4.5 oz) - 128g 1 cup, sliced - 144g 1 cup, melted - 240g
Vitamin C
Vit. C
Vitamin D
Vit. D
Vitamin A
Vit. A
Vitamin E
Vit. E
Vitamin B1
Vit. B1
Vitamin B2
Vit. B2
Vitamin B3
Vit. B3
Vitamin B5
Vit. B5
Vitamin B6
Vit. B6
Vitamin B12
Vit. B12
Vitamin K
Vit. K
Folate
Folate
0%
7.5%
58%
4.8%
18%
120%
7.1%
41%
54%
206%
5.8%
49%
6
100 g
300 g
1 tsp chopped - 1g 1 tbsp chopped - 3g
Vitamin C
Vit. C
Vitamin D
Vit. D
Vitamin A
Vit. A
Vitamin E
Vit. E
Vitamin B1
Vit. B1
Vitamin B2
Vit. B2
Vitamin B3
Vit. B3
Vitamin B5
Vit. B5
Vitamin B6
Vit. B6
Vitamin B12
Vit. B12
Vitamin K
Vit. K
Folate
Folate
194%
0%
73%
4.2%
20%
27%
12%
19%
32%
0%
532%
79%
All nutrients comparison - raw data values
Nutrient
DV% diff.
Vitamin K
2.3µg
212.7µg
175%
Saturated fat
17.41g
0.146g
78%
Vitamin B12
1.65µg
0µg
69%
Vitamin C
0mg
58.1mg
65%
Fats
27.68g
0.73g
41%
Protein
20.75g
3.27g
35%
Cholesterol
100mg
0mg
33%
Vitamin B2
0.52mg
0.115mg
31%
Sodium
629mg
3mg
27%
Selenium
14.5µg
0.9µg
25%
Monounsaturated fat
8.013g
0.095g
20%
Phosphorus
188mg
58mg
19%
Zinc
2.38mg
0.56mg
17%
Calories
334kcal
30kcal
15%
Copper
0.019mg
0.157mg
15%
Manganese
0.034mg
0.373mg
15%
Iron
0.5mg
1.6mg
14%
Fiber
0g
2.5g
10%
Folate
65µg
105µg
10%
Calcium
184mg
92mg
9%
Vitamin B5
0.69mg
0.324mg
7%
Vitamin B6
0.235mg
0.138mg
7%
Magnesium
20mg
42mg
5%
Vitamin A
174µg
218µg
5%
Potassium
152mg
296mg
4%
Polyunsaturated fat
0.826g
0.267g
4%
Vitamin D*
20 IU
0 IU
3%
Vitamin D
0.5µg
0µg
3%
Vitamin B3
0.38mg
0.647mg
2%
Choline
15.4mg
5.2mg
2%
Carbs
0.45g
4.35g
1%
Vitamin B1
0.07mg
0.078mg
1%
Protein per 100 calories
6.2g
11g
N/A
Calories per 10 g protein
161kcal
92kcal
N/A
Weight per 100 calories
30g
333g
N/A
Unsaturated / Saturated Fat ratio
0.51
2.5
N/A
Net carbs
0.45g
1.85g
N/A
Sugar
0.45g
1.85g
N/A
Vitamin E
0.24mg
0.21mg
0%
Tryptophan
0.322mg
0.037mg
0%
Threonine
0.751mg
0.128mg
0%
Isoleucine
1.015mg
0.139mg
0%
Leucine
1.929mg
0.195mg
0%
Lysine
1.851mg
0.163mg
0%
Methionine
0.592mg
0.036mg
0%
Phenylalanine
1.158mg
0.105mg
0%
Valine
1.34mg
0.145mg
0%
Histidine
0.716mg
0.057mg
0%
Macronutrient Comparison
Macronutrient breakdown side-by-side comparison
3
21%
28%
48%
3%
Protein:
20.75 g
Fats:
27.68 g
Carbs:
0.45 g
Water:
48.42 g
Other:
2.7 g
2
3%
4%
91%
Protein:
3.27 g
Fats:
0.73 g
Carbs:
4.35 g
Water:
90.65 g
Other:
1 g
Contains
more
Protein Protein
+534.6%
Contains
more
Fats Fats
+3691.8%
Contains
more
Other Other
+170%
Contains
more
Carbs Carbs
+866.7%
Contains
more
Water Water
+87.2%
Fat Type Comparison
Fat type breakdown side-by-side comparison
2
66%
31%
3%
Saturated fat:
Sat. Fat
17.41 g
Monounsaturated fat:
Mono. Fat
8.013 g
Polyunsaturated fat:
Poly. Fat
0.826 g
1
29%
19%
53%
Saturated fat:
Sat. Fat
0.146 g
Monounsaturated fat:
Mono. Fat
0.095 g
Polyunsaturated fat:
Poly. Fat
0.267 g
Contains
more
Mono. Fat Monounsaturated fat
+8334.7%
Contains
more
Poly. Fat Polyunsaturated fat
+209.4%
Contains
less
Sat. Fat Saturated fat
-99.2%