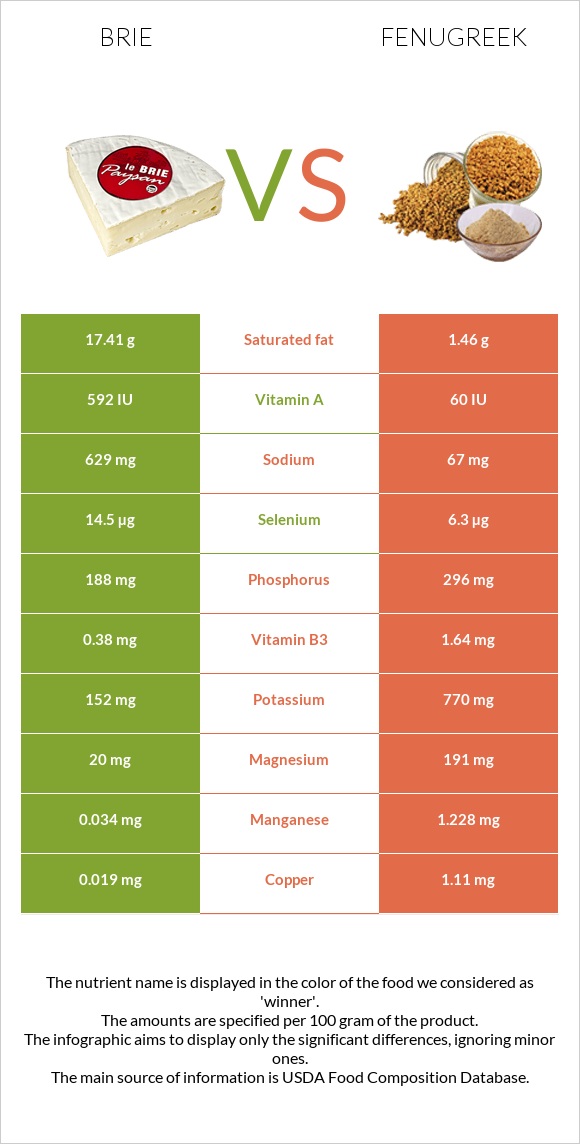
A recap on the differences between brie and fenugreek Brie is higher in vitamin B12, yet fenugreek is higher in iron, copper, fiber, manganese, magnesium, and vitamin B6. Fenugreek covers your daily iron needs 413% more than brie. The amount of cholesterol in fenugreek is lower. Food varieties used in this article are Cheese, brie and Spices, fenugreek seed .
Infographic
Mineral Comparison
Mineral comparison score is based on the number of minerals by which one or the other food is richer. The "coverage" charts below show how much of the daily needs can be covered by 300 grams of the food.
1
100 g
300 g
1 cubic inch - 17g 1 oz - 28.35g 1 package (4.5 oz) - 128g 1 cup, sliced - 144g 1 cup, melted - 240g
Magnesium
Magnesium
Calcium
Calcium
Potassium
Potassium
Iron
Iron
Copper
Copper
Zinc
Zinc
Phosphorus
Phosphorus
Sodium
Sodium
Manganese
Manganese
Selenium
Selenium
14%
55%
13%
19%
6.3%
65%
81%
82%
4.4%
79%
7
100 g
300 g
0.25 tsp - 0.5g 1 tbsp - 11.1g
Magnesium
Magnesium
Calcium
Calcium
Potassium
Potassium
Iron
Iron
Copper
Copper
Zinc
Zinc
Phosphorus
Phosphorus
Sodium
Sodium
Manganese
Manganese
Selenium
Selenium
136%
53%
68%
1257%
370%
68%
127%
8.7%
160%
34%
Vitamin Comparison
Vitamin comparison score is based on the number of vitamins by which one or the other food is richer. The "coverage" charts below show how much of the daily needs can be covered by 300 grams of the food.
8
100 g
300 g
1 cubic inch - 17g 1 oz - 28.35g 1 package (4.5 oz) - 128g 1 cup, sliced - 144g 1 cup, melted - 240g
Vitamin C
Vit. C
Vitamin D
Vit. D
Vitamin A
Vit. A
Vitamin E
Vit. E
Vitamin B1
Vit. B1
Vitamin B2
Vit. B2
Vitamin B3
Vit. B3
Vitamin B5
Vit. B5
Vitamin B6
Vit. B6
Vitamin B12
Vit. B12
Vitamin K
Vit. K
Folate
Folate
0%
7.5%
58%
4.8%
18%
120%
7.1%
41%
54%
206%
5.8%
49%
4
100 g
300 g
0.25 tsp - 0.5g 1 tbsp - 11.1g
Vitamin C
Vit. C
Vitamin D
Vit. D
Vitamin A
Vit. A
Vitamin E
Vit. E
Vitamin B1
Vit. B1
Vitamin B2
Vit. B2
Vitamin B3
Vit. B3
Vitamin B5
Vit. B5
Vitamin B6
Vit. B6
Vitamin B12
Vit. B12
Vitamin K
Vit. K
Folate
Folate
10%
0%
1%
0%
81%
84%
31%
0%
138%
0%
0%
43%
All nutrients comparison - raw data values
Nutrient
DV% diff.
Iron
0.5mg
33.53mg
413%
Copper
0.019mg
1.11mg
121%
Fiber
0g
24.6g
98%
Saturated fat
17.41g
1.46g
73%
Vitamin B12
1.65µg
0µg
69%
Manganese
0.034mg
1.228mg
52%
Magnesium
20mg
191mg
41%
Fats
27.68g
6.41g
33%
Cholesterol
100mg
0mg
33%
Vitamin B6
0.235mg
0.6mg
28%
Sodium
629mg
67mg
24%
Vitamin B1
0.07mg
0.322mg
21%
Monounsaturated fat
8.013g
20%
Carbs
0.45g
58.35g
19%
Vitamin A
174µg
3µg
19%
Potassium
152mg
770mg
18%
Phosphorus
188mg
296mg
15%
Selenium
14.5µg
6.3µg
15%
Vitamin B5
0.69mg
14%
Vitamin B2
0.52mg
0.366mg
12%
Vitamin B3
0.38mg
1.64mg
8%
Polyunsaturated fat
0.826g
6%
Protein
20.75g
23g
5%
Vitamin C
0mg
3mg
3%
Vitamin D*
20 IU
0 IU
3%
Vitamin D
0.5µg
0µg
3%
Choline
15.4mg
3%
Vitamin E
0.24mg
2%
Vitamin K
2.3µg
2%
Folate
65µg
57µg
2%
Calories
334kcal
323kcal
1%
Calcium
184mg
176mg
1%
Zinc
2.38mg
2.5mg
1%
Protein per 100 calories
6.2g
7.1g
N/A
Calories per 10 g protein
161kcal
140kcal
N/A
Weight per 100 calories
30g
31g
N/A
Unsaturated / Saturated Fat ratio
0.51
0
N/A
Net carbs
0.45g
33.75g
N/A
Sugar
0.45g
N/A
Tryptophan
0.322mg
0.391mg
0%
Threonine
0.751mg
0.898mg
0%
Isoleucine
1.015mg
1.241mg
0%
Leucine
1.929mg
1.757mg
0%
Lysine
1.851mg
1.684mg
0%
Methionine
0.592mg
0.338mg
0%
Phenylalanine
1.158mg
1.089mg
0%
Valine
1.34mg
1.102mg
0%
Histidine
0.716mg
0.668mg
0%
Macronutrient Comparison
Macronutrient breakdown side-by-side comparison
2
21%
28%
48%
3%
Protein:
20.75 g
Fats:
27.68 g
Carbs:
0.45 g
Water:
48.42 g
Other:
2.7 g
3
23%
6%
58%
9%
3%
Protein:
23 g
Fats:
6.41 g
Carbs:
58.35 g
Water:
8.84 g
Other:
3.4 g
Contains
more
Fats Fats
+331.8%
Contains
more
Water Water
+447.7%
Contains
more
Protein Protein
+10.8%
Contains
more
Carbs Carbs
+12866.7%
Contains
more
Other Other
+25.9%
Fat Type Comparison
Fat type breakdown side-by-side comparison
2
66%
31%
3%
Saturated fat:
Sat. Fat
17.41 g
Monounsaturated fat:
Mono. Fat
8.013 g
Polyunsaturated fat:
Poly. Fat
0.826 g
1
100%
Saturated fat:
Sat. Fat
1.46 g
Monounsaturated fat:
Mono. Fat
0 g
Polyunsaturated fat:
Poly. Fat
0 g
Contains
more
Mono. Fat Monounsaturated fat
+∞%
Contains
more
Poly. Fat Polyunsaturated fat
+∞%
Contains
less
Sat. Fat Saturated fat
-91.6%