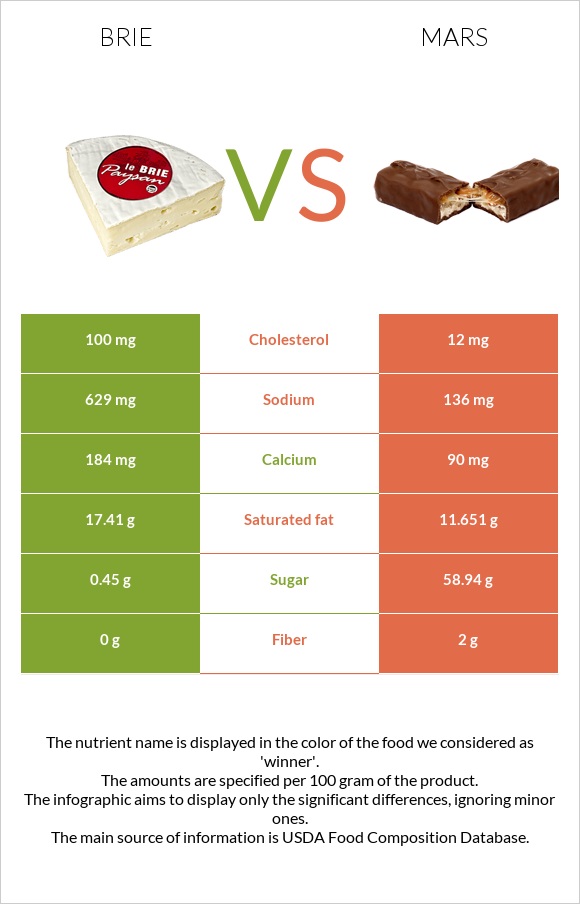
How are brie and mars different? Brie is richer in calcium and vitamin A, while mars is higher in fiber. Brie covers your daily need for cholesterol, 29% more than mars. Brie contains 5 times more sodium than mars. Brie contains 629mg of sodium, while mars contains 136mg. Mars is lower in cholesterol. Mars has a higher glycemic index (62) than brie (0). Cheese, brie and Candies, MARS SNACKFOOD US, M&M's Crispy Chocolate Candies types were used in this article.
Infographic
Mineral Comparison
Mineral comparison score is based on the number of minerals by which one or the other food is richer. The "coverage" charts below show how much of the daily needs can be covered by 300 grams of the food.
8
100 g
300 g
1 cubic inch - 17g 1 oz - 28.35g 1 package (4.5 oz) - 128g 1 cup, sliced - 144g 1 cup, melted - 240g
Magnesium
Magnesium
Calcium
Calcium
Potassium
Potassium
Iron
Iron
Copper
Copper
Zinc
Zinc
Phosphorus
Phosphorus
Sodium
Sodium
Manganese
Manganese
Selenium
Selenium
14%
55%
13%
19%
6.3%
65%
81%
82%
4.4%
79%
2
100 g
300 g
1 serving 1.6 oz bag - 47g
Magnesium
Magnesium
Calcium
Calcium
Potassium
Potassium
Iron
Iron
Copper
Copper
Zinc
Zinc
Phosphorus
Phosphorus
Sodium
Sodium
Manganese
Manganese
Selenium
Selenium
0%
27%
0%
32%
0%
0%
0%
18%
0%
0%
Vitamin Comparison
Vitamin comparison score is based on the number of vitamins by which one or the other food is richer. The "coverage" charts below show how much of the daily needs can be covered by 300 grams of the food.
11
100 g
300 g
1 cubic inch - 17g 1 oz - 28.35g 1 package (4.5 oz) - 128g 1 cup, sliced - 144g 1 cup, melted - 240g
Vitamin C
Vit. C
Vitamin D
Vit. D
Vitamin A
Vit. A
Vitamin E
Vit. E
Vitamin B1
Vit. B1
Vitamin B2
Vit. B2
Vitamin B3
Vit. B3
Vitamin B5
Vit. B5
Vitamin B6
Vit. B6
Vitamin B12
Vit. B12
Vitamin K
Vit. K
Folate
Folate
0%
7.5%
58%
4.8%
18%
120%
7.1%
41%
54%
206%
5.8%
49%
1
100 g
300 g
1 serving 1.6 oz bag - 47g
Vitamin C
Vit. C
Vitamin D
Vit. D
Vitamin A
Vit. A
Vitamin E
Vit. E
Vitamin B1
Vit. B1
Vitamin B2
Vit. B2
Vitamin B3
Vit. B3
Vitamin B5
Vit. B5
Vitamin B6
Vit. B6
Vitamin B12
Vit. B12
Vitamin K
Vit. K
Folate
Folate
1.7%
0%
0%
0%
0%
0%
0%
0%
0%
0%
0%
0%
All nutrients comparison - raw data values
Nutrient
DV% diff.
Vitamin B12
1.65µg
69%
Vitamin B2
0.52mg
40%
Protein
20.75g
4.28g
33%
Cholesterol
100mg
12mg
29%
Phosphorus
188mg
27%
Selenium
14.5µg
26%
Saturated fat
17.41g
11.651g
26%
Carbs
0.45g
72.4g
24%
Zinc
2.38mg
22%
Sodium
629mg
136mg
21%
Monounsaturated fat
8.013g
20%
Vitamin A
174µg
19%
Vitamin B6
0.235mg
18%
Folate
65µg
16%
Vitamin B5
0.69mg
14%
Fats
27.68g
19.32g
13%
Calcium
184mg
90mg
9%
Fiber
0g
2g
8%
Calories
334kcal
475kcal
7%
Vitamin B1
0.07mg
6%
Polyunsaturated fat
0.826g
6%
Magnesium
20mg
5%
Iron
0.5mg
0.86mg
5%
Potassium
152mg
4%
Vitamin D*
20 IU
3%
Vitamin D
0.5µg
3%
Choline
15.4mg
3%
Copper
0.019mg
2%
Vitamin E
0.24mg
2%
Vitamin B3
0.38mg
2%
Vitamin K
2.3µg
2%
Vitamin C
0mg
0.5mg
1%
Manganese
0.034mg
1%
Protein per 100 calories
6.2g
0.9g
N/A
Calories per 10 g protein
161kcal
1110kcal
N/A
Weight per 100 calories
30g
21g
N/A
Unsaturated / Saturated Fat ratio
0.51
0
N/A
Net carbs
0.45g
70.4g
N/A
Sugar
0.45g
58.94g
N/A
Trans fat
0.131g
N/A
Tryptophan
0.322mg
0%
Threonine
0.751mg
0%
Isoleucine
1.015mg
0%
Leucine
1.929mg
0%
Lysine
1.851mg
0%
Methionine
0.592mg
0%
Phenylalanine
1.158mg
0%
Valine
1.34mg
0%
Histidine
0.716mg
0%
Macronutrient Comparison
Macronutrient breakdown side-by-side comparison
4
21%
28%
48%
3%
Protein:
20.75 g
Fats:
27.68 g
Carbs:
0.45 g
Water:
48.42 g
Other:
2.7 g
1
4%
19%
72%
2%
2%
Protein:
4.28 g
Fats:
19.32 g
Carbs:
72.4 g
Water:
1.7 g
Other:
2.3 g
Contains
more
Protein Protein
+384.8%
Contains
more
Fats Fats
+43.3%
Contains
more
Water Water
+2748.2%
Contains
more
Other Other
+17.4%
Contains
more
Carbs Carbs
+15988.9%
Fat Type Comparison
Fat type breakdown side-by-side comparison
2
66%
31%
3%
Saturated fat:
Sat. Fat
17.41 g
Monounsaturated fat:
Mono. Fat
8.013 g
Polyunsaturated fat:
Poly. Fat
0.826 g
1
100%
Saturated fat:
Sat. Fat
11.651 g
Monounsaturated fat:
Mono. Fat
0 g
Polyunsaturated fat:
Poly. Fat
0 g
Contains
more
Mono. Fat Monounsaturated fat
+∞%
Contains
more
Poly. Fat Polyunsaturated fat
+∞%
Contains
less
Sat. Fat Saturated fat
-33.1%