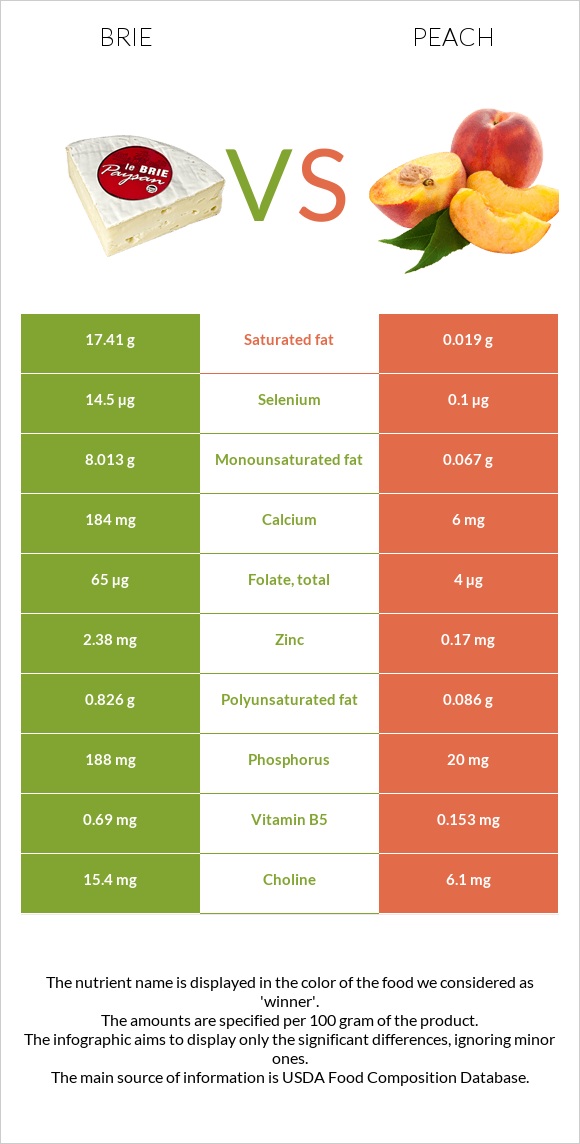
Important differences between brie and peach Peach has less vitamin B12, vitamin B2, selenium, phosphorus, zinc, calcium, and vitamin B6. Brie's daily need coverage for saturated fat is 87% more. Peach is lower in cholesterol. Peach has a higher glycemic index than brie. The food varieties used in the comparison are Cheese, brie and Peaches, yellow, raw .
Infographic
Mineral Comparison
Mineral comparison score is based on the number of minerals by which one or the other food is richer. The "coverage" charts below show how much of the daily needs can be covered by 300 grams of the food.
6
100 g
300 g
1 cubic inch - 17g 1 oz - 28.35g 1 package (4.5 oz) - 128g 1 cup, sliced - 144g 1 cup, melted - 240g
Magnesium
Magnesium
Calcium
Calcium
Potassium
Potassium
Iron
Iron
Copper
Copper
Zinc
Zinc
Phosphorus
Phosphorus
Sodium
Sodium
Manganese
Manganese
Selenium
Selenium
14%
55%
13%
19%
6.3%
65%
81%
82%
4.4%
79%
4
100 g
300 g
1 small (2-1/2" dia) - 130g 1 NLEA serving - 147g 1 medium (2-2/3" dia) - 150g 1 cup slices - 154g 1 large (2-3/4" dia) - 175g 1 extra large (3" dia) - 224g
Magnesium
Magnesium
Calcium
Calcium
Potassium
Potassium
Iron
Iron
Copper
Copper
Zinc
Zinc
Phosphorus
Phosphorus
Sodium
Sodium
Manganese
Manganese
Selenium
Selenium
6.4%
1.8%
17%
9.4%
23%
4.6%
8.6%
0%
8%
0.55%
Vitamin Comparison
Vitamin comparison score is based on the number of vitamins by which one or the other food is richer. The "coverage" charts below show how much of the daily needs can be covered by 300 grams of the food.
8
100 g
300 g
1 cubic inch - 17g 1 oz - 28.35g 1 package (4.5 oz) - 128g 1 cup, sliced - 144g 1 cup, melted - 240g
Vitamin C
Vit. C
Vitamin D
Vit. D
Vitamin A
Vit. A
Vitamin E
Vit. E
Vitamin B1
Vit. B1
Vitamin B2
Vit. B2
Vitamin B3
Vit. B3
Vitamin B5
Vit. B5
Vitamin B6
Vit. B6
Vitamin B12
Vit. B12
Vitamin K
Vit. K
Folate
Folate
0%
7.5%
58%
4.8%
18%
120%
7.1%
41%
54%
206%
5.8%
49%
4
100 g
300 g
1 small (2-1/2" dia) - 130g 1 NLEA serving - 147g 1 medium (2-2/3" dia) - 150g 1 cup slices - 154g 1 large (2-3/4" dia) - 175g 1 extra large (3" dia) - 224g
Vitamin C
Vit. C
Vitamin D
Vit. D
Vitamin A
Vit. A
Vitamin E
Vit. E
Vitamin B1
Vit. B1
Vitamin B2
Vit. B2
Vitamin B3
Vit. B3
Vitamin B5
Vit. B5
Vitamin B6
Vit. B6
Vitamin B12
Vit. B12
Vitamin K
Vit. K
Folate
Folate
22%
0%
5.3%
15%
6%
7.2%
15%
9.2%
5.8%
0%
6.5%
3%
All nutrients comparison - raw data values
Nutrient
DV% diff.
Saturated fat
17.41g
0.019g
79%
Vitamin B12
1.65µg
0µg
69%
Fats
27.68g
0.25g
42%
Protein
20.75g
0.91g
40%
Vitamin B2
0.52mg
0.031mg
38%
Cholesterol
100mg
0mg
33%
Sodium
629mg
0mg
27%
Selenium
14.5µg
0.1µg
26%
Phosphorus
188mg
20mg
24%
Zinc
2.38mg
0.17mg
20%
Monounsaturated fat
8.013g
0.067g
20%
Calcium
184mg
6mg
18%
Vitamin A
174µg
16µg
18%
Vitamin B6
0.235mg
0.025mg
16%
Calories
334kcal
39kcal
15%
Folate
65µg
4µg
15%
Vitamin B5
0.69mg
0.153mg
11%
Vitamin C
0mg
6.6mg
7%
Fiber
0g
1.5g
6%
Copper
0.019mg
0.068mg
5%
Polyunsaturated fat
0.826g
0.086g
5%
Vitamin B1
0.07mg
0.024mg
4%
Carbs
0.45g
9.54g
3%
Vitamin D*
20 IU
0 IU
3%
Vitamin D
0.5µg
0µg
3%
Magnesium
20mg
9mg
3%
Iron
0.5mg
0.25mg
3%
Vitamin E
0.24mg
0.73mg
3%
Vitamin B3
0.38mg
0.806mg
3%
Choline
15.4mg
6.1mg
2%
Fructose
1.53g
2%
Potassium
152mg
190mg
1%
Manganese
0.034mg
0.061mg
1%
Protein per 100 calories
6.2g
2.3g
N/A
Calories per 10 g protein
161kcal
429kcal
N/A
Weight per 100 calories
30g
256g
N/A
Unsaturated / Saturated Fat ratio
0.51
8.1
N/A
Net carbs
0.45g
8.04g
N/A
Sugar
0.45g
8.39g
N/A
Vitamin K
2.3µg
2.6µg
0%
Tryptophan
0.322mg
0.01mg
0%
Threonine
0.751mg
0.016mg
0%
Isoleucine
1.015mg
0.017mg
0%
Leucine
1.929mg
0.027mg
0%
Lysine
1.851mg
0.03mg
0%
Methionine
0.592mg
0.01mg
0%
Phenylalanine
1.158mg
0.019mg
0%
Valine
1.34mg
0.022mg
0%
Histidine
0.716mg
0.013mg
0%
Macronutrient Comparison
Macronutrient breakdown side-by-side comparison
3
21%
28%
48%
3%
Protein:
20.75 g
Fats:
27.68 g
Carbs:
0.45 g
Water:
48.42 g
Other:
2.7 g
2
10%
89%
Protein:
0.91 g
Fats:
0.25 g
Carbs:
9.54 g
Water:
88.87 g
Other:
0.43 g
Contains
more
Protein Protein
+2180.2%
Contains
more
Fats Fats
+10972%
Contains
more
Other Other
+527.9%
Contains
more
Carbs Carbs
+2020%
Contains
more
Water Water
+83.5%
Fat Type Comparison
Fat type breakdown side-by-side comparison
2
66%
31%
3%
Saturated fat:
Sat. Fat
17.41 g
Monounsaturated fat:
Mono. Fat
8.013 g
Polyunsaturated fat:
Poly. Fat
0.826 g
1
11%
39%
50%
Saturated fat:
Sat. Fat
0.019 g
Monounsaturated fat:
Mono. Fat
0.067 g
Polyunsaturated fat:
Poly. Fat
0.086 g
Contains
more
Mono. Fat Monounsaturated fat
+11859.7%
Contains
more
Poly. Fat Polyunsaturated fat
+860.5%
Contains
less
Sat. Fat Saturated fat
-99.9%