Peach nutrition: calories, carbs, GI, protein, fiber, fats
Peaches, yellow, raw
*all the values are displayed for the amount of 100 grams
Medically reviewed by Elen Khachatrian


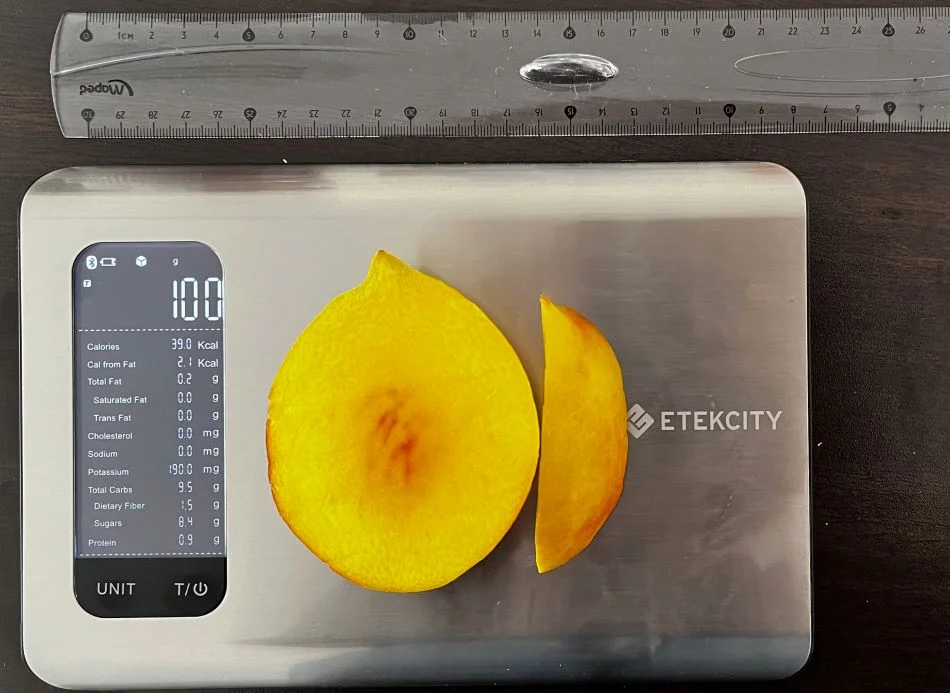
What Do 39 Calories or 100 Grams of Peach Look Like?
We measured how much 100 grams of peach looks like to show you its weight and calories. In the picture below, you can see that one and a half pieces of peach make up the whole 100 grams or 39 calories. So, one peach is about 250 grams or 98 calories.
One serving size of a peach, which is 147g, contains 57 calories accordingly.
Keep in mind that the weight and calories might be different based on the size and ripeness of the peach you have.

Education: General Medicine at YSMU
Last updated: October 31, 2023
Medically reviewed by Elen Khachatrian
Top nutrition facts for Peach
| Calories ⓘ Calories for selected serving | 39 kcal |
|
Glycemic index ⓘ
Source: Check out our full article on Peach glycemic index Check out our Glycemic index chart page for the full list.
|
42 (low) |
| Glycemic load ⓘ Glycemic Load (GL) is a metric that measures both the quality (Glycemic Index) and quantity of carbohydrates in a specific serving of food to estimate its impact on blood sugar levels. It is calculated as: (GI × Carbs in grams) / 100. | 5 (low) |
| Insulin index ⓘ The insulin index of foods demonstrates how much a food increases the insulin level in the blood, in the first two-hour period after consumption. |
39 ⓘ
https://ses.library.usyd.edu.au/handle/2123/11945 – II for raw peaches is 39; II for peaches canned in juice is 54; II for peaches canned in syrup is 65 |
| Net carbs ⓘ Net Carbs = Total Carbohydrates – Fiber – Sugar Alcohols | 8 g |
| Default serving size ⓘ Serving sizes are mostly taken from FDA's Reference Amounts Customarily Consumed (RACCs) | 1 NLEA serving (147 g) |
| Acidity (Based on PRAL) ⓘ PRAL (Potential renal acid load) is calculated using a formula. On the PRAL scale the higher the positive value, the more is the acidifying effect on the body. The lower the negative value, the higher the alkalinity of the food. 0 is neutral. | -3.1 (alkaline) |
| Oxalates | 1 mg ⓘ https://www.sciencedirect.com/science/article/abs/pii/S0308814602002121 |
Peach calories (kcal)
| Calories for different serving sizes of peach | Calories | Weight |
|---|---|---|
| Calories in 100 grams | 39 | |
| Calories in 1 NLEA serving | 57 | 147 g |
| Calories in 1 cup slices | 60 | 154 g |
Extra Nutrition facts for Peach
| Protein per 100 calories ⓘ Shows how many grams of protein you get from 100 calories of this food, calculated as (protein in g ÷ calories) × 100. | 2.3 g |
| Calories per 10 g protein ⓘ Shows how many calories you need to eat from this food to get 10 g of protein, calculated as (calories ÷ protein in g) × 10. | 429 kcal |
| Weight per 100 calories ⓘ Shows how many grams of this food equal 100 kcal—higher grams mean a larger portion for the same calories. | 256 g |
| Fluoride | 4 mcg ⓘ https://fdc.nal.usda.gov/food-details/169928/nutrients |
| Sulfur | 36 mg ⓘ https://www.researchgate.net/publication/353842143 |
| Chlorogenic acid | 6 mg ⓘ https://www.tandfonline.com/doi/abs/10.1080/87559129.2020.1837861 |
| Neochlorogenic acid | 2 mg ⓘ https://www.tandfonline.com/doi/abs/10.1080/87559129.2020.1837861 |
| Quercetin | 0,4 mg ⓘ https://www.tandfonline.com/doi/abs/10.1080/87559129.2020.1837861 |
| Cyanidin | 1 mg ⓘ https://www.tandfonline.com/doi/abs/10.1080/87559129.2020.1837861 |
| Epicatechin | 6 mg ⓘ https://www.researchgate.net/publication/293193334 |
| Catechin | 2 mg ⓘ https://www.researchgate.net/publication/293193334 |
Peach Glycemic index (GI)
Source:
Check out our full article on Peach glycemic index
Check out our Glycemic index chart page for the full list.
Peach Glycemic load (GL)
Mineral coverage chart
Mineral chart - relative view
Vitamin coverage chart
Vitamin A:
48µg of 900µg
5.3%
Vitamin E:
2.2mg of 15mg
15%
Vitamin D:
0µg of 20µg
0%
Vitamin C:
20mg of 90mg
22%
Vitamin B1:
0.07mg of 1mg
6%
Vitamin B2:
0.09mg of 1mg
7.2%
Vitamin B3:
2.4mg of 16mg
15%
Vitamin B5:
0.46mg of 5mg
9.2%
Vitamin B6:
0.08mg of 1mg
5.8%
Folate:
12µg of 400µg
3%
Vitamin B12:
0µg of 2µg
0%
Vitamin K:
7.8µg of 120µg
6.5%
Vitamin chart - relative view
Macronutrients chart
Protein:
Daily Value: 2%
0.9 g of 50 g
0.9 g (2% of DV )
Fats:
Daily Value: 0%
0.3 g of 65 g
0.3 g (0% of DV )
Carbs:
Daily Value: 3%
9.5 g of 300 g
9.5 g (3% of DV )
Water:
Daily Value: 4%
88.9 g of 2,000 g
88.9 g (4% of DV )
Other:
0.4 g
0.4 g
Protein quality breakdown
Tryptophan:
30mg of 280mg
11%
Threonine:
48mg of 1,050mg
4.6%
Isoleucine:
51mg of 1,400mg
3.6%
Leucine:
81mg of 2,730mg
3%
Lysine:
90mg of 2,100mg
4.3%
Methionine:
30mg of 1,050mg
2.9%
Phenylalanine:
57mg of 1,750mg
3.3%
Valine:
66mg of 1,820mg
3.6%
Histidine:
39mg of 700mg
5.6%
Fat type information
Saturated fat:
0.02 g
Monounsaturated fat:
0.07 g
Polyunsaturated fat:
0.09 g
Carbohydrate type breakdown
Starch:
0 g
Sucrose:
4.8 g
Glucose:
2 g
Fructose:
1.5 g
Lactose:
0 g
Maltose:
0.08 g
Galactose:
0.06 g
Fiber content ratio for Peach
Sugar:
8.4 g
Fiber:
1.5 g
Other:
0 g
All nutrients for Peach per 100g
| Nutrient | Value | DV% | In TOP % of foods | Comparison |
| Vitamin A | 16µg | 2% | 28% | |
| Calories | 39kcal | 2% | 91% |
1.2 times less than Orange
|
| Calories per 10 g protein | 429kcal | N/A | 29% | |
| Weight per 100 calories | 256g | N/A | 9% | |
| Protein | 0.91g | 2% | 86% |
3.1 times less than Broccoli
|
| Protein per 100 calories | 2.3g | N/A | 68% | |
| Fats | 0.25g | 0% | 86% |
133.2 times less than Cheese
|
| Vitamin C | 6.6mg | 7% | 19% |
8 times less than Lemon
|
| Carbs | 9.5g | 3% | 50% |
3 times less than Rice
|
| Net carbs | 8g | N/A | 50% |
6.7 times less than Chocolate
|
| Cholesterol | 0mg | 0% | 100% |
N/A
|
| Vitamin D* | 0 IU | 0% | 100% |
N/A
|
| Vitamin D | 0µg | 0% | 100% |
N/A
|
| Magnesium | 9mg | 2% | 78% |
15.6 times less than Almonds
|
| Calcium | 6mg | 1% | 85% |
20.8 times less than Milk
|
| Potassium | 190mg | 6% | 57% |
1.3 times more than Cucumber
|
| Iron | 0.25mg | 3% | 86% |
10.4 times less than Beef broiled
|
| Sugar | 8.4g | N/A | 21% |
1.1 times less than Coca-Cola
|
| Fiber | 1.5g | 6% | 37% |
1.6 times less than Orange
|
| Copper | 0.07mg | 8% | 57% |
2.1 times less than Shiitake
|
| Zinc | 0.17mg | 2% | 79% |
37.1 times less than Beef broiled
|
| Starch | 0g | 0% | 100% |
N/A
|
| Phosphorus | 20mg | 3% | 82% |
9.1 times less than Chicken meat
|
| Sodium | 0mg | 0% | 100% |
N/A
|
| Vitamin E | 0.73mg | 5% | 18% |
2 times less than Kiwi
|
| Manganese | 0.06mg | 3% | 41% | |
| Selenium | 0.1µg | 0% | 77% | |
| Vitamin B1 | 0.02mg | 2% | 78% |
11.1 times less than Pea raw
|
| Vitamin B2 | 0.03mg | 2% | 80% |
4.2 times less than Avocado
|
| Vitamin B3 | 0.81mg | 5% | 65% |
11.9 times less than Turkey meat
|
| Vitamin B5 | 0.15mg | 3% | 59% |
7.4 times less than Sunflower seeds
|
| Vitamin B6 | 0.03mg | 2% | 79% |
4.8 times less than Oats
|
| Vitamin B12 | 0µg | 0% | 100% |
N/A
|
| Vitamin K | 2.6µg | 2% | 22% |
39.1 times less than Broccoli
|
| Folate | 4µg | 1% | 69% |
15.3 times less than Brussels sprouts
|
| Trans fat | 0g | N/A | 100% |
N/A
|
| Choline | 6.1mg | 1% | 45% | |
| Saturated fat | 0.02g | 0% | 88% |
310.3 times less than Beef broiled
|
| Monounsaturated fat | 0.07g | N/A | 76% |
146.3 times less than Avocado
|
| Polyunsaturated fat | 0.09g | N/A | 79% |
548.5 times less than Walnut
|
| Tryptophan | 0.01mg | 0% | 54% |
30.5 times less than Chicken meat
|
| Threonine | 0.02mg | 0% | 57% |
45 times less than Beef broiled
|
| Isoleucine | 0.02mg | 0% | 56% |
53.8 times less than Salmon raw
|
| Leucine | 0.03mg | 0% | 56% |
90 times less than Tuna Bluefin
|
| Lysine | 0.03mg | 0% | 56% |
15.1 times less than Tofu
|
| Methionine | 0.01mg | 0% | 55% |
9.6 times less than Quinoa
|
| Phenylalanine | 0.02mg | 0% | 56% |
35.2 times less than Egg
|
| Valine | 0.02mg | 0% | 56% |
92.2 times less than Soybean raw
|
| Histidine | 0.01mg | 0% | 56% |
57.6 times less than Turkey meat
|
| Fructose | 1.5g | 2% | 5% |
3.9 times less than Apple
|
| Caffeine | 0mg | 0% | 100% | |
| Omega-3 - EPA | 0g | N/A | 100% |
N/A
|
| Omega-3 - DHA | 0g | N/A | 100% |
N/A
|
| Omega-3 - DPA | 0g | N/A | 100% |
N/A
|
Check out similar food or compare with current
NUTRITION FACTS LABEL
Nutrition Facts
___servings per container
Serving Size ______________
Serving Size ______________
Amount Per 100g
Calories 39
% Daily Value*
0.38%
Total Fat
0.25g
0.09%
Saturated Fat 0.02g
0
Trans Fat
0g
0
Cholesterol 0mg
0
Sodium 0mg
3.2%
Total Carbohydrate
9.5g
6%
Dietary Fiber
1.5g
Total Sugars 0g
Includes ? g Added Sugars
Protein
0.91g
Vitamin D
0mcg
0
Calcium
6mg
0.6%
Iron
0.25mg
3.1%
Potassium
190mg
5.6%
*
The % Daily Value (DV) tells you how much a nutrient in a serving of food contributes to a daily diet. 2,000 calories a day is used for general nutrition advice.
Health checks
ⓘ
Dietary cholesterol is not associated with an increased risk of coronary heart disease in healthy individuals. However, dietary cholesterol is common in foods that are high in harmful saturated fats.
Source
Low in Cholesterol
ⓘ
Trans fat consumption increases the risk of cardiovascular disease and mortality by negatively affecting blood lipid levels.
Source
No Trans Fats
ⓘ
Saturated fat intake can raise total cholesterol and LDL (low-density lipoprotein) levels, leading to an increased risk of atherosclerosis. Dietary guidelines recommend limiting saturated fats to under 10% of calories a day.
Source
Low in Saturated Fats
ⓘ
While the consumption of moderate amounts of added sugars is not detrimental to health, an excessive intake can increase the risk of obesity, and therefore, diabetes.
Source
Low in Sugars
Peach nutrition infographic
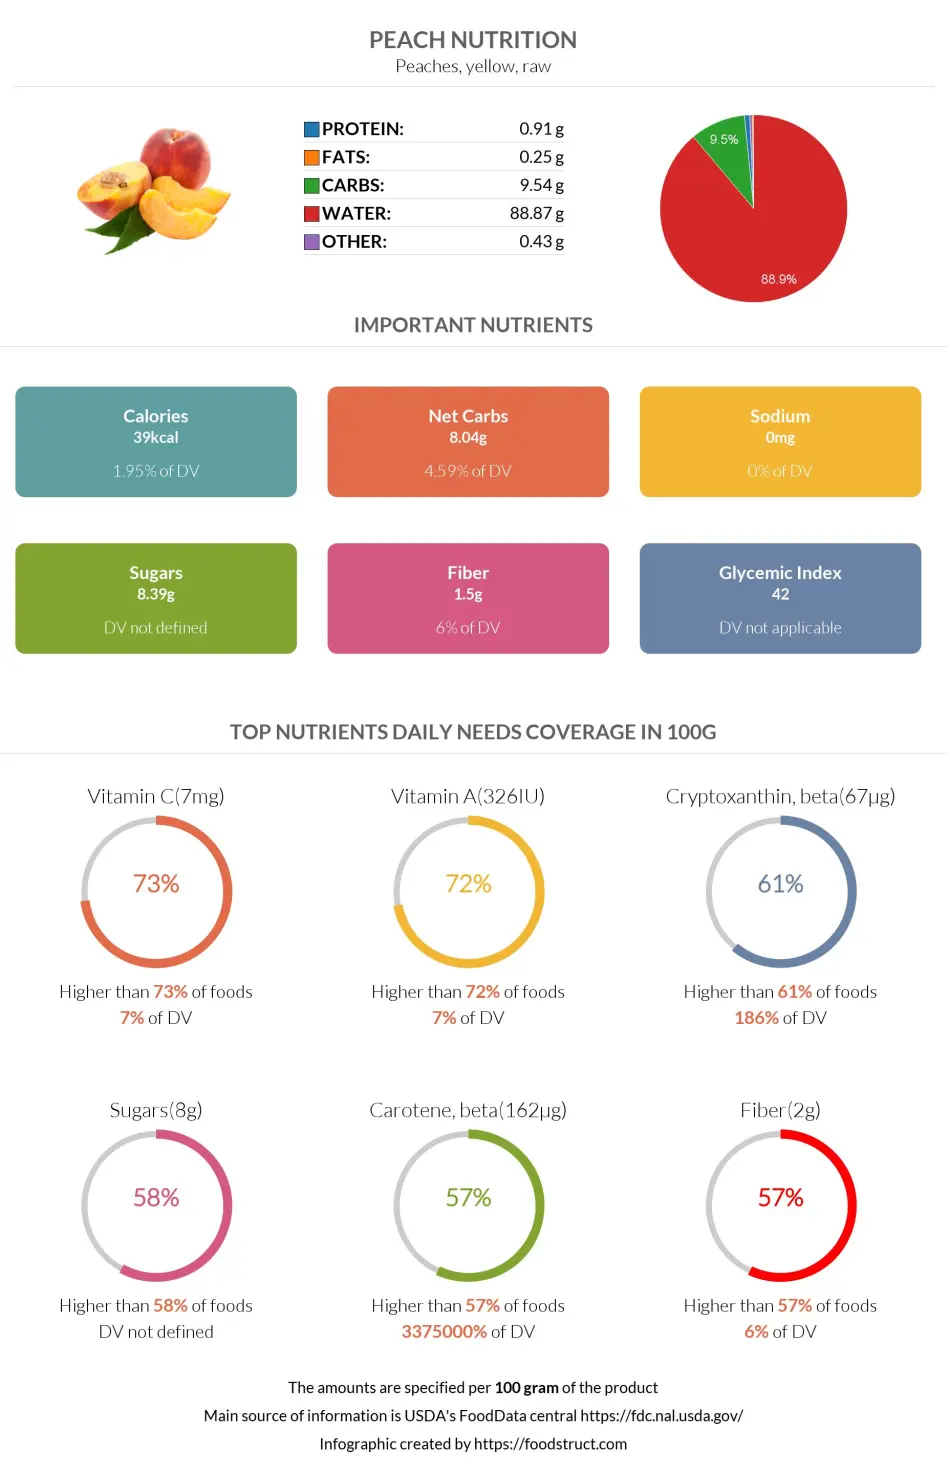
Infographic link
References
All the values for which the sources are not specified explicitly are taken from FDA’s Food Central. The exact link to the food presented on this page can be found below.