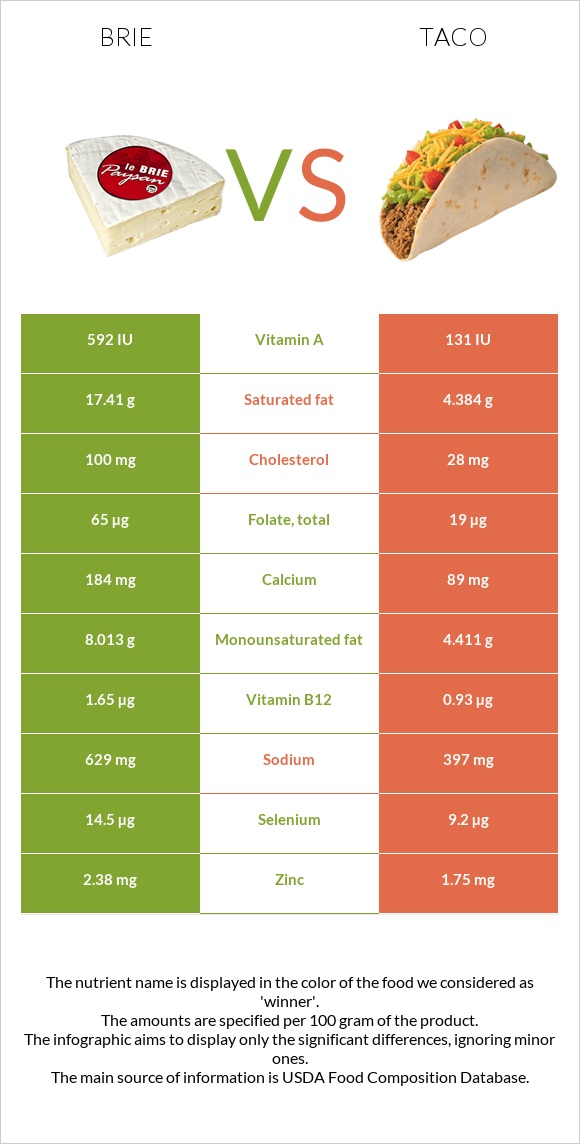
How are brie and taco different? Brie is richer in vitamin B2, vitamin B12, folate, vitamin B6, and selenium, while taco is higher in fiber and vitamin K. Brie covers your daily need for saturated fat, 65% more than taco. Brie contains 9 times more vitamin B2 than taco. Brie contains 0.52mg of vitamin B2, while taco contains 0.06mg. Taco is lower in saturated fat. Taco has a higher glycemic index (39) than brie (0). Cheese, brie and Fast foods, taco with beef, cheese, and lettuce, hard shell types were used in this article.
Infographic
Mineral Comparison
Mineral comparison score is based on the number of minerals by which one or the other food is richer. The "coverage" charts below show how much of the daily needs can be covered by 300 grams of the food.
3
100 g
300 g
1 cubic inch - 17g 1 oz - 28.35g 1 package (4.5 oz) - 128g 1 cup, sliced - 144g 1 cup, melted - 240g
Magnesium
Magnesium
Calcium
Calcium
Potassium
Potassium
Iron
Iron
Copper
Copper
Zinc
Zinc
Phosphorus
Phosphorus
Sodium
Sodium
Manganese
Manganese
Selenium
Selenium
14%
55%
13%
19%
6.3%
65%
81%
82%
4.4%
79%
6
100 g
300 g
1 each taco - 69g
Magnesium
Magnesium
Calcium
Calcium
Potassium
Potassium
Iron
Iron
Copper
Copper
Zinc
Zinc
Phosphorus
Phosphorus
Sodium
Sodium
Manganese
Manganese
Selenium
Selenium
23%
27%
18%
45%
26%
48%
76%
52%
32%
50%
Vitamin Comparison
Vitamin comparison score is based on the number of vitamins by which one or the other food is richer. The "coverage" charts below show how much of the daily needs can be covered by 300 grams of the food.
8
100 g
300 g
1 cubic inch - 17g 1 oz - 28.35g 1 package (4.5 oz) - 128g 1 cup, sliced - 144g 1 cup, melted - 240g
Vitamin C
Vit. C
Vitamin D
Vit. D
Vitamin A
Vit. A
Vitamin E
Vit. E
Vitamin B1
Vit. B1
Vitamin B2
Vit. B2
Vitamin B3
Vit. B3
Vitamin B5
Vit. B5
Vitamin B6
Vit. B6
Vitamin B12
Vit. B12
Vitamin K
Vit. K
Folate
Folate
0%
7.5%
58%
4.8%
18%
120%
7.1%
41%
54%
206%
5.8%
49%
4
100 g
300 g
1 each taco - 69g
Vitamin C
Vit. C
Vitamin D
Vit. D
Vitamin A
Vit. A
Vitamin E
Vit. E
Vitamin B1
Vit. B1
Vitamin B2
Vit. B2
Vitamin B3
Vit. B3
Vitamin B5
Vit. B5
Vitamin B6
Vit. B6
Vitamin B12
Vit. B12
Vitamin K
Vit. K
Folate
Folate
1.3%
1.5%
6.7%
12%
13%
14%
31%
0%
21%
116%
38%
14%
All nutrients comparison - raw data values
Nutrient
DV% diff.
Saturated fat
17.41g
4.384g
59%
Vitamin B2
0.52mg
0.06mg
35%
Vitamin B12
1.65µg
0.93µg
30%
Protein
20.75g
8.86g
24%
Cholesterol
100mg
28mg
24%
Fats
27.68g
12.7g
23%
Vitamin A
174µg
20µg
17%
Fiber
0g
3.9g
16%
Polyunsaturated fat
0.826g
3.042g
15%
Vitamin B5
0.69mg
14%
Folate
65µg
19µg
12%
Vitamin B6
0.235mg
0.09mg
11%
Vitamin K
2.3µg
15.3µg
11%
Calcium
184mg
89mg
10%
Sodium
629mg
397mg
10%
Selenium
14.5µg
9.2µg
10%
Iron
0.5mg
1.19mg
9%
Manganese
0.034mg
0.249mg
9%
Monounsaturated fat
8.013g
4.411g
9%
Vitamin B3
0.38mg
1.65mg
8%
Carbs
0.45g
19.85g
6%
Copper
0.019mg
0.077mg
6%
Zinc
2.38mg
1.75mg
6%
Starch
14.78g
6%
Calories
334kcal
226kcal
5%
Magnesium
20mg
32mg
3%
Choline
15.4mg
32mg
3%
Vitamin D*
20 IU
4 IU
2%
Vitamin D
0.5µg
0.1µg
2%
Potassium
152mg
209mg
2%
Vitamin E
0.24mg
0.6mg
2%
Vitamin B1
0.07mg
0.05mg
2%
Phosphorus
188mg
178mg
1%
Protein per 100 calories
6.2g
3.9g
N/A
Calories per 10 g protein
161kcal
255kcal
N/A
Weight per 100 calories
30g
44g
N/A
Unsaturated / Saturated Fat ratio
0.51
1.7
N/A
Vitamin C
0mg
0.4mg
0%
Net carbs
0.45g
15.95g
N/A
Sugar
0.45g
0.9g
N/A
Trans fat
0.467g
N/A
Tryptophan
0.322mg
0%
Threonine
0.751mg
0%
Isoleucine
1.015mg
0%
Leucine
1.929mg
0%
Lysine
1.851mg
0%
Methionine
0.592mg
0%
Phenylalanine
1.158mg
0%
Valine
1.34mg
0%
Histidine
0.716mg
0%
Fructose
0.3g
0%
Omega-3 - EPA
0g
0.005g
N/A
Omega-3 - ALA
0.166g
N/A
Omega-3 - DPA
0g
0.006g
N/A
Omega-3 - Eicosatrienoic acid
0.001g
N/A
Omega-6 - Gamma-linoleic acid
0.002g
N/A
Omega-6 - Dihomo-gamma-linoleic acid
0.011g
N/A
Omega-6 - Eicosadienoic acid
0.004g
N/A
Omega-6 - Linoleic acid
2.708g
N/A
Macronutrient Comparison
Macronutrient breakdown side-by-side comparison
3
21%
28%
48%
3%
Protein:
20.75 g
Fats:
27.68 g
Carbs:
0.45 g
Water:
48.42 g
Other:
2.7 g
2
9%
13%
20%
57%
Protein:
8.86 g
Fats:
12.7 g
Carbs:
19.85 g
Water:
57.02 g
Other:
1.57 g
Contains
more
Protein Protein
+134.2%
Contains
more
Fats Fats
+118%
Contains
more
Other Other
+72%
Contains
more
Carbs Carbs
+4311.1%
Contains
more
Water Water
+17.8%
Fat Type Comparison
Fat type breakdown side-by-side comparison
1
66%
31%
3%
Saturated fat:
Sat. Fat
17.41 g
Monounsaturated fat:
Mono. Fat
8.013 g
Polyunsaturated fat:
Poly. Fat
0.826 g
2
37%
37%
26%
Saturated fat:
Sat. Fat
4.384 g
Monounsaturated fat:
Mono. Fat
4.411 g
Polyunsaturated fat:
Poly. Fat
3.042 g
Contains
more
Mono. Fat Monounsaturated fat
+81.7%
Contains
less
Sat. Fat Saturated fat
-74.8%
Contains
more
Poly. Fat Polyunsaturated fat
+268.3%