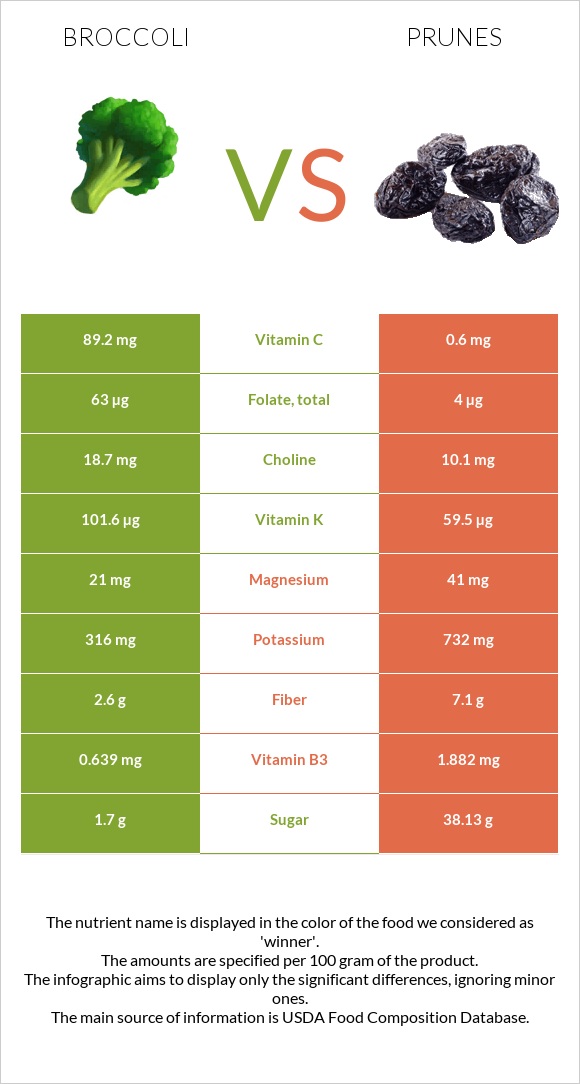
Differences between broccoli and prunes Broccoli is higher in vitamin C, vitamin K, and folate; however, prunes are richer in copper, fiber, potassium, vitamin B3, and vitamin B2. Broccoli's daily need coverage for vitamin C is 98% higher. Broccoli has 16 times more folate than prunes. While broccoli has 63µg of folate, prunes have only 4µg. The food types used in this comparison are Broccoli, raw and Plums, dried (prunes), uncooked .
Infographic
Mineral Comparison
Mineral comparison score is based on the number of minerals by which one or the other food is richer. The "coverage" charts below show how much of the daily needs can be covered by 300 grams of the food.
1
100 g
300 g
1 spear (about 5" long) - 31g 0.5 cup, chopped or diced - 44g 1 cup chopped - 91g 1 NLEA serving - 148g 1 stalk - 151g 1 bunch - 608g
Magnesium
Magnesium
Calcium
Calcium
Potassium
Potassium
Iron
Iron
Copper
Copper
Zinc
Zinc
Phosphorus
Phosphorus
Sodium
Sodium
Manganese
Manganese
Selenium
Selenium
15%
14%
28%
27%
16%
11%
28%
4.3%
27%
14%
6
100 g
300 g
1 prune, pitted - 9.5g 1 cup, pitted - 174g
Magnesium
Magnesium
Calcium
Calcium
Potassium
Potassium
Iron
Iron
Copper
Copper
Zinc
Zinc
Phosphorus
Phosphorus
Sodium
Sodium
Manganese
Manganese
Selenium
Selenium
29%
13%
65%
35%
94%
12%
30%
0.26%
39%
1.6%
Vitamin Comparison
Vitamin comparison score is based on the number of vitamins by which one or the other food is richer. The "coverage" charts below show how much of the daily needs can be covered by 300 grams of the food.
6
100 g
300 g
1 spear (about 5" long) - 31g 0.5 cup, chopped or diced - 44g 1 cup chopped - 91g 1 NLEA serving - 148g 1 stalk - 151g 1 bunch - 608g
Vitamin C
Vit. C
Vitamin D
Vit. D
Vitamin A
Vit. A
Vitamin E
Vit. E
Vitamin B1
Vit. B1
Vitamin B2
Vit. B2
Vitamin B3
Vit. B3
Vitamin B5
Vit. B5
Vitamin B6
Vit. B6
Vitamin B12
Vit. B12
Vitamin K
Vit. K
Folate
Folate
297%
0%
10%
16%
18%
27%
12%
34%
40%
0%
254%
47%
4
100 g
300 g
1 prune, pitted - 9.5g 1 cup, pitted - 174g
Vitamin C
Vit. C
Vitamin D
Vit. D
Vitamin A
Vit. A
Vitamin E
Vit. E
Vitamin B1
Vit. B1
Vitamin B2
Vit. B2
Vitamin B3
Vit. B3
Vitamin B5
Vit. B5
Vitamin B6
Vit. B6
Vitamin B12
Vit. B12
Vitamin K
Vit. K
Folate
Folate
2%
0%
13%
8.6%
13%
43%
35%
25%
47%
0%
149%
3%
All nutrients comparison - raw data values
Nutrient
DV% diff.
Vitamin C
89.2mg
0.6mg
98%
Vitamin K
101.6µg
59.5µg
35%
Copper
0.049mg
0.281mg
26%
Carbs
6.64g
63.88g
19%
Fiber
2.6g
7.1g
18%
Folate
63µg
4µg
15%
Fructose
0.68g
12.45g
15%
Potassium
316mg
732mg
12%
Calories
34kcal
240kcal
10%
Vitamin B3
0.639mg
1.882mg
8%
Magnesium
21mg
41mg
5%
Vitamin B2
0.117mg
0.186mg
5%
Manganese
0.21mg
0.299mg
4%
Selenium
2.5µg
0.3µg
4%
Iron
0.73mg
0.93mg
3%
Vitamin B5
0.573mg
0.422mg
3%
Starch
0g
5.11g
2%
Vitamin E
0.78mg
0.43mg
2%
Vitamin B1
0.071mg
0.051mg
2%
Vitamin B6
0.175mg
0.205mg
2%
Choline
18.7mg
10.1mg
2%
Protein
2.82g
2.18g
1%
Sodium
33mg
2mg
1%
Vitamin A
31µg
39µg
1%
Protein per 100 calories
8.3g
0.91g
N/A
Calories per 10 g protein
121kcal
1101kcal
N/A
Weight per 100 calories
294g
42g
N/A
Fats
0.37g
0.38g
0%
Net carbs
4.04g
56.78g
N/A
Calcium
47mg
43mg
0%
Sugar
1.7g
38.13g
N/A
Zinc
0.41mg
0.44mg
0%
Phosphorus
66mg
69mg
0%
Saturated fat
0.039g
0.088g
0%
Monounsaturated fat
0.011g
0.053g
0%
Polyunsaturated fat
0.038g
0.062g
0%
Tryptophan
0.033mg
0.025mg
0%
Threonine
0.088mg
0.049mg
0%
Isoleucine
0.079mg
0.041mg
0%
Leucine
0.129mg
0.066mg
0%
Lysine
0.135mg
0.05mg
0%
Methionine
0.038mg
0.016mg
0%
Phenylalanine
0.117mg
0.052mg
0%
Valine
0.125mg
0.056mg
0%
Histidine
0.059mg
0.027mg
0%
Macronutrient Comparison
Macronutrient breakdown side-by-side comparison
2
3%
7%
89%
Protein:
2.82 g
Fats:
0.37 g
Carbs:
6.64 g
Water:
89.3 g
Other:
0.87 g
3
2%
64%
31%
3%
Protein:
2.18 g
Fats:
0.38 g
Carbs:
63.88 g
Water:
30.92 g
Other:
2.64 g
Contains
more
Protein Protein
+29.4%
Contains
more
Water Water
+188.8%
Contains
more
Carbs Carbs
+862%
Contains
more
Other Other
+203.4%
Fat Type Comparison
Fat type breakdown side-by-side comparison
1
44%
13%
43%
Saturated fat:
Sat. Fat
0.039 g
Monounsaturated fat:
Mono. Fat
0.011 g
Polyunsaturated fat:
Poly. Fat
0.038 g
2
43%
26%
31%
Saturated fat:
Sat. Fat
0.088 g
Monounsaturated fat:
Mono. Fat
0.053 g
Polyunsaturated fat:
Poly. Fat
0.062 g
Contains
less
Sat. Fat Saturated fat
-55.7%
Contains
more
Mono. Fat Monounsaturated fat
+381.8%
Contains
more
Poly. Fat Polyunsaturated fat
+63.2%
Carbohydrate type comparison
Carbohydrate type breakdown side-by-side comparison
2
6%
29%
40%
12%
12%
Starch:
0 g
Sucrose:
0.1 g
Glucose:
0.49 g
Fructose:
0.68 g
Lactose:
0.21 g
Maltose:
0.21 g
Galactose:
0 g
4
12%
59%
29%
Starch:
5.11 g
Sucrose:
0.15 g
Glucose:
25.46 g
Fructose:
12.45 g
Lactose:
0 g
Maltose:
0.06 g
Galactose:
0 g
Contains
more
Lactose Lactose
+∞%
Contains
more
Maltose Maltose
+250%
Contains
more
Starch Starch
+∞%
Contains
more
Sucrose Sucrose
+50%
Contains
more
Glucose Glucose
+5095.9%
Contains
more
Fructose Fructose
+1730.9%