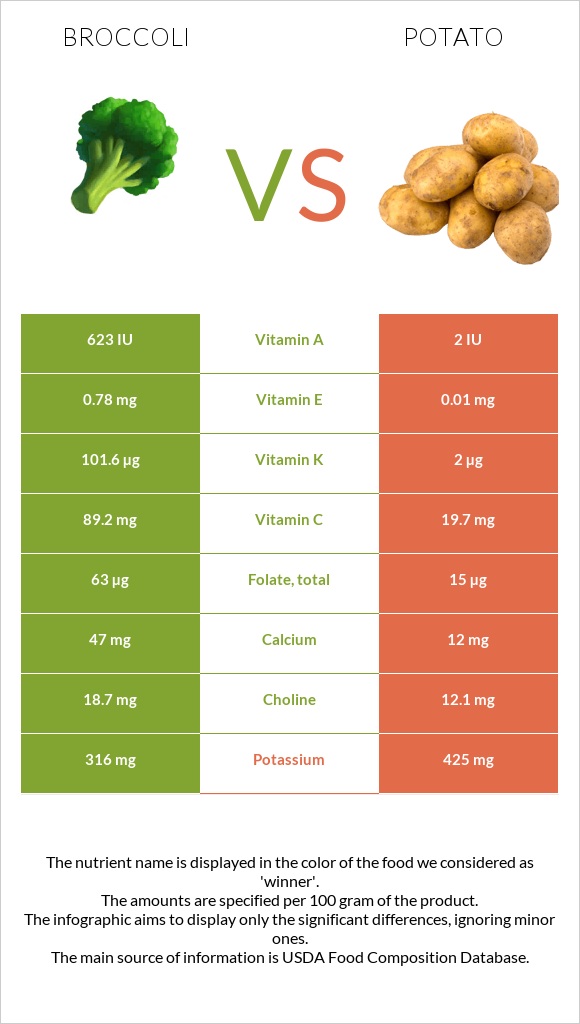
The main differences between broccoli and potatoes Broccoli has more vitamin C, vitamin K, vitamin A, folate, and vitamin B2; however, potatoes have more vitamin B6, copper, and potassium. Daily need coverage for vitamin C for broccoli is 88% higher. Potatoes have 62 times less vitamin A than broccoli. Broccoli has 623 IU of vitamin A, while potatoes have 10 IU. Potatoes have a higher glycemic index than broccoli. Food types used in this article are Broccoli, raw and Potatoes, baked, flesh, and skin, without salt .
Infographic
Mineral Comparison
Mineral comparison score is based on the number of minerals by which one or the other food is richer. The "coverage" charts below show how much of the daily needs can be covered by 300 grams of the food.
3
100 g
300 g
1 spear (about 5" long) - 31g 0.5 cup, chopped or diced - 44g 1 cup chopped - 91g 1 NLEA serving - 148g 1 stalk - 151g 1 bunch - 608g
Magnesium
Magnesium
Calcium
Calcium
Potassium
Potassium
Iron
Iron
Copper
Copper
Zinc
Zinc
Phosphorus
Phosphorus
Sodium
Sodium
Manganese
Manganese
Selenium
Selenium
15%
14%
28%
27%
16%
11%
28%
4.3%
27%
14%
5
100 g
300 g
1 potato small - 138g 1 NLEA serving - 148g 1 potato medium - 173g 1 potato large - 299g
Magnesium
Magnesium
Calcium
Calcium
Potassium
Potassium
Iron
Iron
Copper
Copper
Zinc
Zinc
Phosphorus
Phosphorus
Sodium
Sodium
Manganese
Manganese
Selenium
Selenium
20%
4.5%
47%
41%
39%
9.8%
30%
1.3%
29%
2.2%
Vitamin Comparison
Vitamin comparison score is based on the number of vitamins by which one or the other food is richer. The "coverage" charts below show how much of the daily needs can be covered by 300 grams of the food.
7
100 g
300 g
1 spear (about 5" long) - 31g 0.5 cup, chopped or diced - 44g 1 cup chopped - 91g 1 NLEA serving - 148g 1 stalk - 151g 1 bunch - 608g
Vitamin C
Vit. C
Vitamin D
Vit. D
Vitamin A
Vit. A
Vitamin E
Vit. E
Vitamin B1
Vit. B1
Vitamin B2
Vit. B2
Vitamin B3
Vit. B3
Vitamin B5
Vit. B5
Vitamin B6
Vit. B6
Vitamin B12
Vit. B12
Vitamin K
Vit. K
Folate
Folate
297%
0%
10%
16%
18%
27%
12%
34%
40%
0%
254%
47%
2
100 g
300 g
1 potato small - 138g 1 NLEA serving - 148g 1 potato medium - 173g 1 potato large - 299g
Vitamin C
Vit. C
Vitamin D
Vit. D
Vitamin A
Vit. A
Vitamin E
Vit. E
Vitamin B1
Vit. B1
Vitamin B2
Vit. B2
Vitamin B3
Vit. B3
Vitamin B5
Vit. B5
Vitamin B6
Vit. B6
Vitamin B12
Vit. B12
Vitamin K
Vit. K
Folate
Folate
32%
0%
0.33%
0.8%
16%
11%
26%
23%
72%
0%
5%
21%
All nutrients comparison - raw data values
Nutrient
DV% diff.
Vitamin C
89.2mg
9.6mg
88%
Vitamin K
101.6µg
2µg
83%
Vitamin B6
0.175mg
0.311mg
10%
Folate
63µg
28µg
9%
Copper
0.049mg
0.118mg
8%
Starch
0g
17.27g
7%
Potassium
316mg
535mg
6%
Carbs
6.64g
21.15g
5%
Vitamin E
0.78mg
0.04mg
5%
Vitamin B2
0.117mg
0.048mg
5%
Vitamin B3
0.639mg
1.41mg
5%
Iron
0.73mg
1.08mg
4%
Selenium
2.5µg
0.4µg
4%
Vitamin B5
0.573mg
0.376mg
4%
Calories
34kcal
93kcal
3%
Calcium
47mg
15mg
3%
Vitamin A
31µg
1µg
3%
Magnesium
21mg
28mg
2%
Fiber
2.6g
2.2g
2%
Protein
2.82g
2.5g
1%
Phosphorus
66mg
70mg
1%
Sodium
33mg
10mg
1%
Vitamin B1
0.071mg
0.064mg
1%
Choline
18.7mg
14.8mg
1%
Protein per 100 calories
8.3g
2.7g
N/A
Calories per 10 g protein
121kcal
372kcal
N/A
Weight per 100 calories
294g
108g
N/A
Fats
0.37g
0.13g
0%
Net carbs
4.04g
18.95g
N/A
Sugar
1.7g
1.18g
N/A
Zinc
0.41mg
0.36mg
0%
Manganese
0.21mg
0.219mg
0%
Saturated fat
0.039g
0.034g
0%
Monounsaturated fat
0.011g
0.003g
0%
Polyunsaturated fat
0.038g
0.057g
0%
Tryptophan
0.033mg
0.025mg
0%
Threonine
0.088mg
0.081mg
0%
Isoleucine
0.079mg
0.08mg
0%
Leucine
0.129mg
0.119mg
0%
Lysine
0.135mg
0.13mg
0%
Methionine
0.038mg
0.038mg
0%
Phenylalanine
0.117mg
0.099mg
0%
Valine
0.125mg
0.125mg
0%
Histidine
0.059mg
0.042mg
0%
Fructose
0.68g
0.34g
0%
Macronutrient Comparison
Macronutrient breakdown side-by-side comparison
3
3%
7%
89%
Protein:
2.82 g
Fats:
0.37 g
Carbs:
6.64 g
Water:
89.3 g
Other:
0.87 g
2
3%
21%
75%
Protein:
2.5 g
Fats:
0.13 g
Carbs:
21.15 g
Water:
74.89 g
Other:
1.33 g
Contains
more
Protein Protein
+12.8%
Contains
more
Fats Fats
+184.6%
Contains
more
Water Water
+19.2%
Contains
more
Carbs Carbs
+218.5%
Contains
more
Other Other
+52.9%
Fat Type Comparison
Fat type breakdown side-by-side comparison
1
44%
13%
43%
Saturated fat:
Sat. Fat
0.039 g
Monounsaturated fat:
Mono. Fat
0.011 g
Polyunsaturated fat:
Poly. Fat
0.038 g
2
36%
3%
61%
Saturated fat:
Sat. Fat
0.034 g
Monounsaturated fat:
Mono. Fat
0.003 g
Polyunsaturated fat:
Poly. Fat
0.057 g
Contains
more
Mono. Fat Monounsaturated fat
+266.7%
Contains
less
Sat. Fat Saturated fat
-12.8%
Contains
more
Poly. Fat Polyunsaturated fat
+50%
Carbohydrate type comparison
Carbohydrate type breakdown side-by-side comparison
4
6%
29%
40%
12%
12%
Starch:
0 g
Sucrose:
0.1 g
Glucose:
0.49 g
Fructose:
0.68 g
Lactose:
0.21 g
Maltose:
0.21 g
Galactose:
0 g
2
94%
2%
2%
2%
Starch:
17.27 g
Sucrose:
0.4 g
Glucose:
0.44 g
Fructose:
0.34 g
Lactose:
0 g
Maltose:
0 g
Galactose:
0 g
Contains
more
Glucose Glucose
+11.4%
Contains
more
Fructose Fructose
+100%
Contains
more
Lactose Lactose
+∞%
Contains
more
Maltose Maltose
+∞%
Contains
more
Starch Starch
+∞%
Contains
more
Sucrose Sucrose
+300%