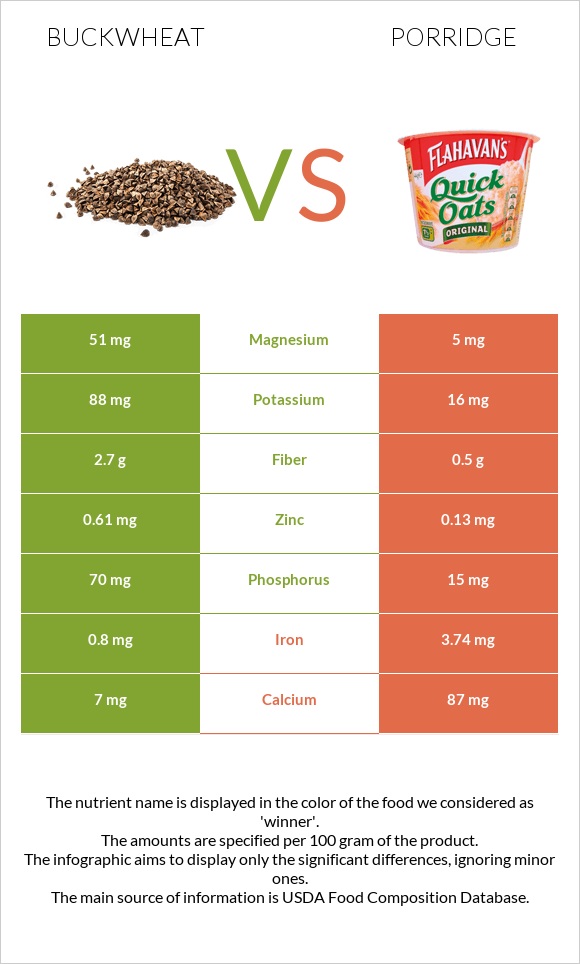
Summary of differences between buckwheat and porridge Buckwheat has more manganese, copper, magnesium, fiber, phosphorus, and vitamin B5, while porridge has more iron and calcium. Porridge covers your daily need for iron, 37% more than buckwheat. Buckwheat has a lower glycemic index. The glycemic index of buckwheat is 51, while the glycemic index of porridge is 66. These are the specific foods used in this comparison Buckwheat groats, roasted, cooked and Cereals, CREAM OF WHEAT, regular (10 minute), cooked with water, without salt .
Infographic
Mineral Comparison
Mineral comparison score is based on the number of minerals by which one or the other food is richer. The "coverage" charts below show how much of the daily needs can be covered by 300 grams of the food.
7
100 g
300 g
1 cup - 168g
Magnesium
Magnesium
Calcium
Calcium
Potassium
Potassium
Iron
Iron
Copper
Copper
Zinc
Zinc
Phosphorus
Phosphorus
Sodium
Sodium
Manganese
Manganese
Selenium
Selenium
36%
2.1%
7.8%
30%
49%
17%
30%
0.52%
53%
12%
3
100 g
300 g
1 tbsp - 16g 1 cup (1 serving) - 251g
Magnesium
Magnesium
Calcium
Calcium
Potassium
Potassium
Iron
Iron
Copper
Copper
Zinc
Zinc
Phosphorus
Phosphorus
Sodium
Sodium
Manganese
Manganese
Selenium
Selenium
3.6%
26%
1.4%
140%
13%
3.5%
6.4%
0.78%
0%
15%
Vitamin Comparison
Vitamin comparison score is based on the number of vitamins by which one or the other food is richer. The "coverage" charts below show how much of the daily needs can be covered by 300 grams of the food.
7
100 g
300 g
1 cup - 168g
Vitamin C
Vit. C
Vitamin D
Vit. D
Vitamin A
Vit. A
Vitamin E
Vit. E
Vitamin B1
Vit. B1
Vitamin B2
Vit. B2
Vitamin B3
Vit. B3
Vitamin B5
Vit. B5
Vitamin B6
Vit. B6
Vitamin B12
Vit. B12
Vitamin K
Vit. K
Folate
Folate
0%
0%
0%
1.8%
10%
9%
18%
22%
18%
0%
4.8%
11%
1
100 g
300 g
1 tbsp - 16g 1 cup (1 serving) - 251g
Vitamin C
Vit. C
Vitamin D
Vit. D
Vitamin A
Vit. A
Vitamin E
Vit. E
Vitamin B1
Vit. B1
Vitamin B2
Vit. B2
Vitamin B3
Vit. B3
Vitamin B5
Vit. B5
Vitamin B6
Vit. B6
Vitamin B12
Vit. B12
Vitamin K
Vit. K
Folate
Folate
0%
0%
0%
0.4%
14%
5.8%
9.8%
4.3%
3%
0%
0.25%
9%
All nutrients comparison - raw data values
Nutrient
DV% diff.
Iron
0.8mg
3.74mg
37%
Manganese
0.403mg
0mg
18%
Copper
0.146mg
0.04mg
12%
Magnesium
51mg
5mg
11%
Fiber
2.7g
0.5g
9%
Calcium
7mg
87mg
8%
Phosphorus
70mg
15mg
8%
Vitamin B5
0.359mg
0.071mg
6%
Vitamin B6
0.077mg
0.013mg
5%
Protein
3.38g
1.44g
4%
Zinc
0.61mg
0.13mg
4%
Choline
20.1mg
4%
Carbs
19.94g
10.52g
3%
Vitamin B3
0.94mg
0.52mg
3%
Calories
92kcal
50kcal
2%
Potassium
88mg
16mg
2%
Vitamin K
1.9µg
0.1µg
2%
Fats
0.62g
0.21g
1%
Selenium
2.2µg
2.8µg
1%
Vitamin B1
0.04mg
0.055mg
1%
Vitamin B2
0.039mg
0.025mg
1%
Folate
14µg
12µg
1%
Protein per 100 calories
3.7g
2.9g
N/A
Calories per 10 g protein
272kcal
347kcal
N/A
Weight per 100 calories
109g
200g
N/A
Net carbs
17.24g
10.02g
N/A
Sugar
0.9g
0.03g
N/A
Sodium
4mg
6mg
0%
Vitamin E
0.09mg
0.02mg
0%
Saturated fat
0.134g
0.033g
0%
Monounsaturated fat
0.188g
0.028g
0%
Polyunsaturated fat
0.188g
0.114g
0%
Tryptophan
0.049mg
0.02mg
0%
Threonine
0.129mg
0.045mg
0%
Isoleucine
0.127mg
0.063mg
0%
Leucine
0.212mg
0.11mg
0%
Lysine
0.172mg
0.037mg
0%
Methionine
0.044mg
0.027mg
0%
Phenylalanine
0.133mg
0.078mg
0%
Valine
0.173mg
0.07mg
0%
Histidine
0.079mg
0.033mg
0%
Fructose
0.1g
0%
Macronutrient Comparison
Macronutrient breakdown side-by-side comparison
4
3%
20%
76%
Protein:
3.38 g
Fats:
0.62 g
Carbs:
19.94 g
Water:
75.63 g
Other:
0.43 g
1
11%
88%
Protein:
1.44 g
Fats:
0.21 g
Carbs:
10.52 g
Water:
87.61 g
Other:
0.22 g
Contains
more
Protein Protein
+134.7%
Contains
more
Fats Fats
+195.2%
Contains
more
Carbs Carbs
+89.5%
Contains
more
Other Other
+95.5%
Contains
more
Water Water
+15.8%
Fat Type Comparison
Fat type breakdown side-by-side comparison
2
26%
37%
37%
Saturated fat:
Sat. Fat
0.134 g
Monounsaturated fat:
Mono. Fat
0.188 g
Polyunsaturated fat:
Poly. Fat
0.188 g
1
19%
16%
65%
Saturated fat:
Sat. Fat
0.033 g
Monounsaturated fat:
Mono. Fat
0.028 g
Polyunsaturated fat:
Poly. Fat
0.114 g
Contains
more
Mono. Fat Monounsaturated fat
+571.4%
Contains
more
Poly. Fat Polyunsaturated fat
+64.9%
Contains
less
Sat. Fat Saturated fat
-75.4%