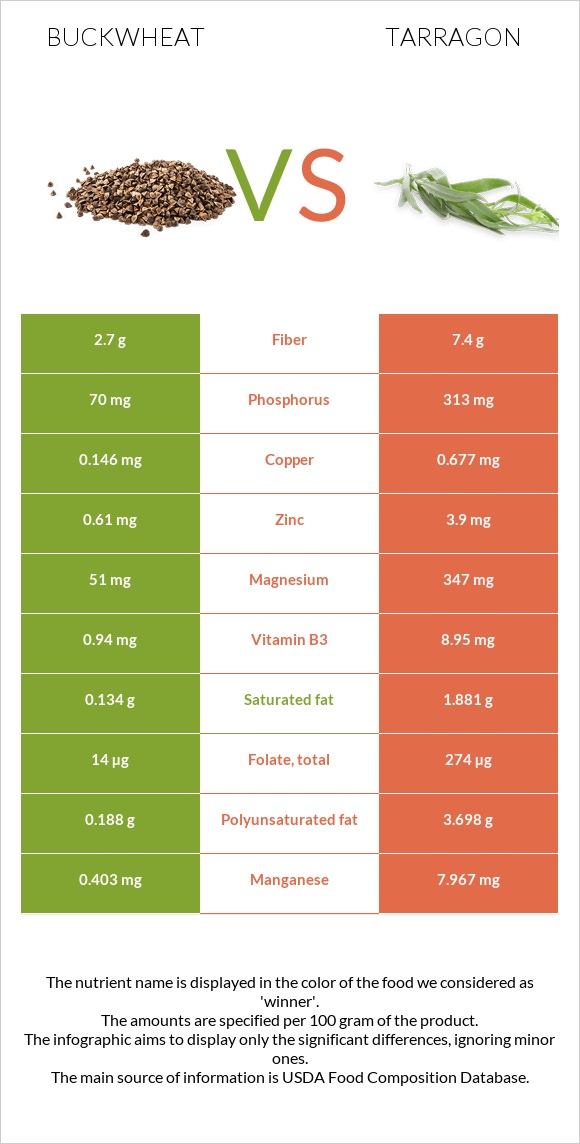
Differences between buckwheat and tarragon Tarragon is higher than buckwheat in iron, manganese, vitamin B6, calcium, vitamin B2, potassium, vitamin A, magnesium, folate, and copper. Tarragon's daily need coverage for iron is 394% higher. Tarragon has a lower glycemic index (0) than buckwheat (51). The food types used in this comparison are Buckwheat groats, roasted, cooked and Spices, tarragon, dried .
Infographic
Mineral Comparison
Mineral comparison score is based on the number of minerals by which one or the other food is richer. The "coverage" charts below show how much of the daily needs can be covered by 300 grams of the food.
1
100 g
300 g
1 cup - 168g
Magnesium
Magnesium
Calcium
Calcium
Potassium
Potassium
Iron
Iron
Copper
Copper
Zinc
Zinc
Phosphorus
Phosphorus
Sodium
Sodium
Manganese
Manganese
Selenium
Selenium
36%
2.1%
7.8%
30%
49%
17%
30%
0.52%
53%
12%
9
100 g
300 g
0.25 tsp - 0.5g 1 tsp, ground - 1.6g 1 tbsp, leaves - 1.8g 1 tbsp, ground - 4.8g
Magnesium
Magnesium
Calcium
Calcium
Potassium
Potassium
Iron
Iron
Copper
Copper
Zinc
Zinc
Phosphorus
Phosphorus
Sodium
Sodium
Manganese
Manganese
Selenium
Selenium
248%
342%
266%
1211%
226%
106%
134%
8.1%
1039%
24%
Vitamin Comparison
Vitamin comparison score is based on the number of vitamins by which one or the other food is richer. The "coverage" charts below show how much of the daily needs can be covered by 300 grams of the food.
3
100 g
300 g
1 cup - 168g
Vitamin C
Vit. C
Vitamin D
Vit. D
Vitamin A
Vit. A
Vitamin E
Vit. E
Vitamin B1
Vit. B1
Vitamin B2
Vit. B2
Vitamin B3
Vit. B3
Vitamin B5
Vit. B5
Vitamin B6
Vit. B6
Vitamin B12
Vit. B12
Vitamin K
Vit. K
Folate
Folate
0%
0%
0%
1.8%
10%
9%
18%
22%
18%
0%
4.8%
11%
7
100 g
300 g
0.25 tsp - 0.5g 1 tsp, ground - 1.6g 1 tbsp, leaves - 1.8g 1 tbsp, ground - 4.8g
Vitamin C
Vit. C
Vitamin D
Vit. D
Vitamin A
Vit. A
Vitamin E
Vit. E
Vitamin B1
Vit. B1
Vitamin B2
Vit. B2
Vitamin B3
Vit. B3
Vitamin B5
Vit. B5
Vitamin B6
Vit. B6
Vitamin B12
Vit. B12
Vitamin K
Vit. K
Folate
Folate
167%
0%
70%
0%
63%
309%
168%
0%
556%
0%
0%
206%
All nutrients comparison - raw data values
Nutrient
DV% diff.
Iron
0.8mg
32.3mg
394%
Manganese
0.403mg
7.967mg
329%
Vitamin B6
0.077mg
2.41mg
179%
Calcium
7mg
1139mg
113%
Vitamin B2
0.039mg
1.339mg
100%
Potassium
88mg
3020mg
86%
Magnesium
51mg
347mg
70%
Folate
14µg
274µg
65%
Copper
0.146mg
0.677mg
59%
Vitamin C
0mg
50mg
56%
Vitamin B3
0.94mg
8.95mg
50%
Protein
3.38g
22.77g
39%
Phosphorus
70mg
313mg
35%
Zinc
0.61mg
3.9mg
30%
Vitamin A
0µg
210µg
23%
Polyunsaturated fat
0.188g
3.698g
23%
Fiber
2.7g
7.4g
19%
Vitamin B1
0.04mg
0.251mg
18%
Calories
92kcal
295kcal
10%
Fats
0.62g
7.24g
10%
Carbs
19.94g
50.22g
10%
Saturated fat
0.134g
1.881g
8%
Vitamin B5
0.359mg
7%
Selenium
2.2µg
4.4µg
4%
Choline
20.1mg
4%
Sodium
4mg
62mg
3%
Vitamin K
1.9µg
2%
Vitamin E
0.09mg
1%
Monounsaturated fat
0.188g
0.474g
1%
Protein per 100 calories
3.7g
7.7g
N/A
Calories per 10 g protein
272kcal
130kcal
N/A
Weight per 100 calories
109g
34g
N/A
Unsaturated / Saturated Fat ratio
2.8
2.2
N/A
Net carbs
17.24g
42.82g
N/A
Sugar
0.9g
N/A
Tryptophan
0.049mg
0%
Threonine
0.129mg
0%
Isoleucine
0.127mg
0%
Leucine
0.212mg
0%
Lysine
0.172mg
0%
Methionine
0.044mg
0%
Phenylalanine
0.133mg
0%
Valine
0.173mg
0%
Histidine
0.079mg
0%
Fructose
0.1g
0%
Macronutrient Comparison
Macronutrient breakdown side-by-side comparison
1
3%
20%
76%
Protein:
3.38 g
Fats:
0.62 g
Carbs:
19.94 g
Water:
75.63 g
Other:
0.43 g
4
23%
7%
50%
8%
12%
Protein:
22.77 g
Fats:
7.24 g
Carbs:
50.22 g
Water:
7.74 g
Other:
12.03 g
Contains
more
Water Water
+877.1%
Contains
more
Protein Protein
+573.7%
Contains
more
Fats Fats
+1067.7%
Contains
more
Carbs Carbs
+151.9%
Contains
more
Other Other
+2697.7%
Fat Type Comparison
Fat type breakdown side-by-side comparison
1
26%
37%
37%
Saturated fat:
Sat. Fat
0.134 g
Monounsaturated fat:
Mono. Fat
0.188 g
Polyunsaturated fat:
Poly. Fat
0.188 g
2
31%
8%
61%
Saturated fat:
Sat. Fat
1.881 g
Monounsaturated fat:
Mono. Fat
0.474 g
Polyunsaturated fat:
Poly. Fat
3.698 g
Contains
less
Sat. Fat Saturated fat
-92.9%
Contains
more
Mono. Fat Monounsaturated fat
+152.1%
Contains
more
Poly. Fat Polyunsaturated fat
+1867%