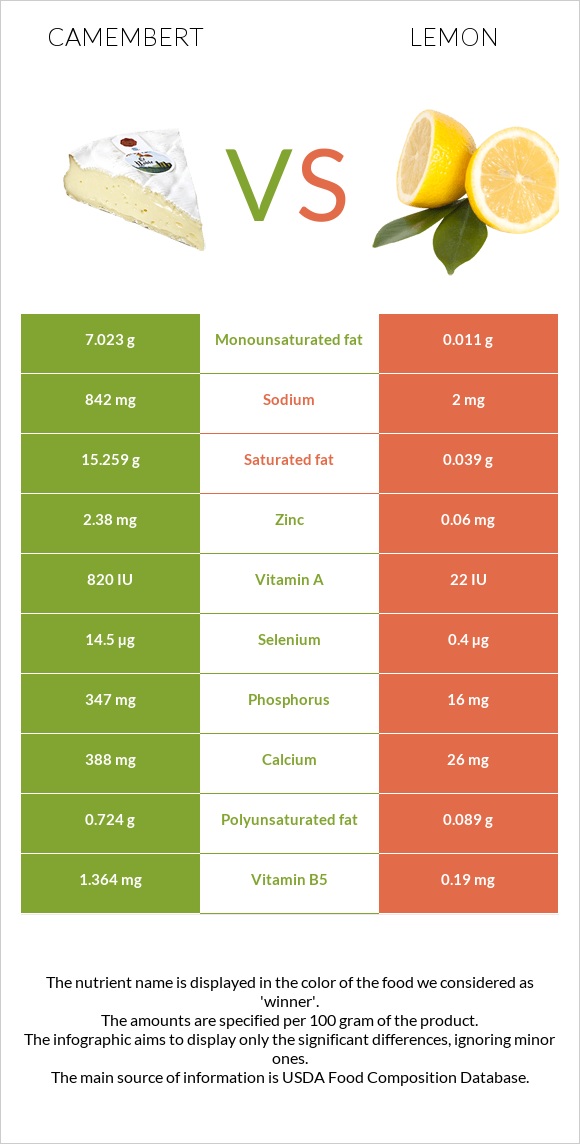
What are the differences between camembert and lemons? Camembert is higher in vitamin B12, phosphorus, calcium, vitamin B2, selenium, and vitamin B5, yet lemons are higher in vitamin C. Camembert's daily need coverage for saturated fat is 76% more. The amount of cholesterol in lemons is lower. We used Cheese, camembert and Lemons, raw, without peel types in this article.
Infographic
Mineral Comparison
Mineral comparison score is based on the number of minerals by which one or the other food is richer. The "coverage" charts below show how much of the daily needs can be covered by 300 grams of the food.
7
100 g
300 g
1 cubic inch - 17g 1 oz - 28.35g 1 wedge (1.33 oz) - 38g 1 cup - 246g
Magnesium
Magnesium
Calcium
Calcium
Potassium
Potassium
Iron
Iron
Copper
Copper
Zinc
Zinc
Phosphorus
Phosphorus
Sodium
Sodium
Manganese
Manganese
Selenium
Selenium
14%
116%
17%
12%
7%
65%
149%
110%
5%
79%
3
100 g
300 g
1 wedge or slice (1/8 of one 2-1/8" dia lemon) - 7g 1 fruit (2-1/8" dia) - 58g 1 NLEA serving - 58g 1 fruit (2-3/8" dia) - 84g 1 cup, sections - 212g
Magnesium
Magnesium
Calcium
Calcium
Potassium
Potassium
Iron
Iron
Copper
Copper
Zinc
Zinc
Phosphorus
Phosphorus
Sodium
Sodium
Manganese
Manganese
Selenium
Selenium
5.7%
7.8%
12%
23%
12%
1.6%
6.9%
0.26%
3.9%
2.2%
Vitamin Comparison
Vitamin comparison score is based on the number of vitamins by which one or the other food is richer. The "coverage" charts below show how much of the daily needs can be covered by 300 grams of the food.
10
100 g
300 g
1 cubic inch - 17g 1 oz - 28.35g 1 wedge (1.33 oz) - 38g 1 cup - 246g
Vitamin C
Vit. C
Vitamin D
Vit. D
Vitamin A
Vit. A
Vitamin E
Vit. E
Vitamin B1
Vit. B1
Vitamin B2
Vit. B2
Vitamin B3
Vit. B3
Vitamin B5
Vit. B5
Vitamin B6
Vit. B6
Vitamin B12
Vit. B12
Vitamin K
Vit. K
Folate
Folate
0%
6%
80%
4.2%
7%
113%
12%
82%
52%
163%
5%
47%
2
100 g
300 g
1 wedge or slice (1/8 of one 2-1/8" dia lemon) - 7g 1 fruit (2-1/8" dia) - 58g 1 NLEA serving - 58g 1 fruit (2-3/8" dia) - 84g 1 cup, sections - 212g
Vitamin C
Vit. C
Vitamin D
Vit. D
Vitamin A
Vit. A
Vitamin E
Vit. E
Vitamin B1
Vit. B1
Vitamin B2
Vit. B2
Vitamin B3
Vit. B3
Vitamin B5
Vit. B5
Vitamin B6
Vit. B6
Vitamin B12
Vit. B12
Vitamin K
Vit. K
Folate
Folate
177%
0%
0.33%
3%
10%
4.6%
1.9%
11%
18%
0%
0%
8.3%
All nutrients comparison - raw data values
Nutrient
DV% diff.
Saturated fat
15.259g
0.039g
69%
Vitamin C
0mg
53mg
59%
Vitamin B12
1.3µg
0µg
54%
Phosphorus
347mg
16mg
47%
Protein
19.8g
1.1g
37%
Fats
24.26g
0.3g
37%
Sodium
842mg
2mg
37%
Calcium
388mg
26mg
36%
Vitamin B2
0.488mg
0.02mg
36%
Vitamin A
241µg
1µg
27%
Selenium
14.5µg
0.4µg
26%
Cholesterol
72mg
0mg
24%
Vitamin B5
1.364mg
0.19mg
23%
Zinc
2.38mg
0.06mg
21%
Monounsaturated fat
7.023g
0.011g
18%
Calories
300kcal
29kcal
14%
Folate
62µg
11µg
13%
Fiber
0g
2.8g
11%
Vitamin B6
0.227mg
0.08mg
11%
Polyunsaturated fat
0.724g
0.089g
4%
Carbs
0.46g
9.32g
3%
Magnesium
20mg
8mg
3%
Iron
0.33mg
0.6mg
3%
Vitamin B3
0.63mg
0.1mg
3%
Vitamin D*
18 IU
0 IU
2%
Vitamin D
0.4µg
0µg
2%
Copper
0.021mg
0.037mg
2%
Vitamin K
2µg
0µg
2%
Choline
15.4mg
5.1mg
2%
Potassium
187mg
138mg
1%
Vitamin B1
0.028mg
0.04mg
1%
Protein per 100 calories
6.6g
3.8g
N/A
Calories per 10 g protein
152kcal
264kcal
N/A
Weight per 100 calories
33g
345g
N/A
Unsaturated / Saturated Fat ratio
0.51
2.6
N/A
Net carbs
0.46g
6.52g
N/A
Sugar
0.46g
2.5g
N/A
Vitamin E
0.21mg
0.15mg
0%
Manganese
0.038mg
0.03mg
0%
Tryptophan
0.307mg
0%
Threonine
0.717mg
0%
Isoleucine
0.968mg
0%
Leucine
1.84mg
0%
Lysine
1.766mg
0%
Methionine
0.565mg
0%
Phenylalanine
1.105mg
0%
Valine
1.279mg
0%
Histidine
0.683mg
0%
Macronutrient Comparison
Macronutrient breakdown side-by-side comparison
3
20%
24%
52%
4%
Protein:
19.8 g
Fats:
24.26 g
Carbs:
0.46 g
Water:
51.8 g
Other:
3.68 g
2
9%
89%
Protein:
1.1 g
Fats:
0.3 g
Carbs:
9.32 g
Water:
88.98 g
Other:
0.3 g
Contains
more
Protein Protein
+1700%
Contains
more
Fats Fats
+7986.7%
Contains
more
Other Other
+1126.7%
Contains
more
Carbs Carbs
+1926.1%
Contains
more
Water Water
+71.8%
Fat Type Comparison
Fat type breakdown side-by-side comparison
2
66%
31%
3%
Saturated fat:
Sat. Fat
15.259 g
Monounsaturated fat:
Mono. Fat
7.023 g
Polyunsaturated fat:
Poly. Fat
0.724 g
1
28%
8%
64%
Saturated fat:
Sat. Fat
0.039 g
Monounsaturated fat:
Mono. Fat
0.011 g
Polyunsaturated fat:
Poly. Fat
0.089 g
Contains
more
Mono. Fat Monounsaturated fat
+63745.5%
Contains
more
Poly. Fat Polyunsaturated fat
+713.5%
Contains
less
Sat. Fat Saturated fat
-99.7%