Infographic
Mineral Comparison
Mineral comparison score is based on the number of minerals by which one or the other food is richer. The "coverage" charts below show how much of the daily needs can be covered by 300 grams of the food.
7
100 g
300 g
1 gumdrop, small (1/2" dia) - 3.2g 1 gumdrop, medium (3/4" dia) - 4.2g 1 spice stick - 9.5g 1 jelly ring (1-1/4" dia) - 10g 1 gumdrop, large (1" dia) - 11.6g 10 gummy bears - 22g 1 spice drop - 24g 10 gumdrops - 36g 10 gummy fish - 50g 10 gummy dinosaurs - 63g 10 gummy worms - 74g 1 cup gumdrops - 182g
Magnesium
Magnesium
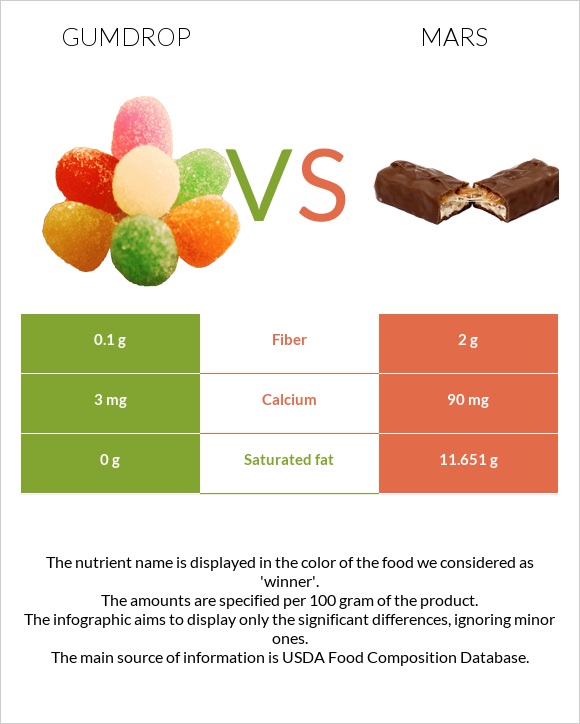
Calcium
Calcium
Potassium
Potassium
Iron
Iron
Copper
Copper
Zinc
Zinc
Phosphorus
Phosphorus
Sodium
Sodium
Manganese
Manganese
Selenium
Selenium
0.71%
0.9%
0.44%
15%
4%
0%
0.43%
5.7%
1.3%
4.4%
2
100 g
300 g
1 serving 1.6 oz bag - 47g
Magnesium
Magnesium
Calcium
Calcium
Potassium
Potassium
Iron
Iron
Copper
Copper
Zinc
Zinc
Phosphorus
Phosphorus
Sodium
Sodium
Manganese
Manganese
Selenium
Selenium
0%
27%
0%
32%
0%
0%
0%
18%
0%
0%
Vitamin Comparison
Vitamin comparison score is based on the number of vitamins by which one or the other food is richer. The "coverage" charts below show how much of the daily needs can be covered by 300 grams of the food.
5
100 g
300 g
1 gumdrop, small (1/2" dia) - 3.2g 1 gumdrop, medium (3/4" dia) - 4.2g 1 spice stick - 9.5g 1 jelly ring (1-1/4" dia) - 10g 1 gumdrop, large (1" dia) - 11.6g 10 gummy bears - 22g 1 spice drop - 24g 10 gumdrops - 36g 10 gummy fish - 50g 10 gummy dinosaurs - 63g 10 gummy worms - 74g 1 cup gumdrops - 182g
Vitamin C
Vit. C
Vitamin D
Vit. D
Vitamin A
Vit. A
Vitamin E
Vit. E
Vitamin B1
Vit. B1
Vitamin B2
Vit. B2
Vitamin B3
Vit. B3
Vitamin B5
Vit. B5
Vitamin B6
Vit. B6
Vitamin B12
Vit. B12
Vitamin K
Vit. K
Folate
Folate
0%
0%
0%
0%
1.5%
3%
0.19%
0.72%
1.2%
0%
0%
0%
1
100 g
300 g
1 serving 1.6 oz bag - 47g
Vitamin C
Vit. C
Vitamin D
Vit. D
Vitamin A
Vit. A
Vitamin E
Vit. E
Vitamin B1
Vit. B1
Vitamin B2
Vit. B2
Vitamin B3
Vit. B3
Vitamin B5
Vit. B5
Vitamin B6
Vit. B6
Vitamin B12
Vit. B12
Vitamin K
Vit. K
Folate
Folate
1.7%
0%
0%
0%
0%
0%
0%
0%
0%
0%
0%
0%
All nutrients comparison - raw data values
Macronutrient Comparison
Macronutrient breakdown side-by-side comparison
1
99%
Protein:
0 g
Fats:
0 g
Carbs:
98.9 g
Water:
1 g
Other:
0.1 g
4
4%
19%
72%
2%
2%
Protein:
4.28 g
Fats:
19.32 g
Carbs:
72.4 g
Water:
1.7 g
Other:
2.3 g
Contains
more
Carbs Carbs
+36.6%
Contains
more
Protein Protein
+∞%
Contains
more
Fats Fats
+∞%
Contains
more
Water Water
+70%
Contains
more
Other Other
+2200%