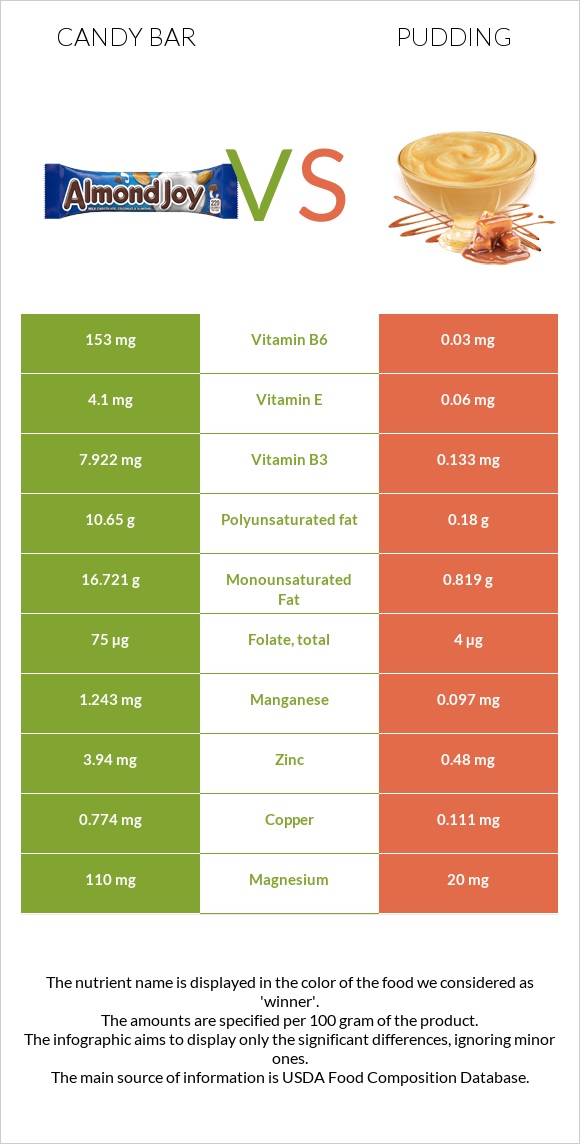
What are the main differences between candy bar and pudding? Candy bar has more vitamin B6, copper, manganese, vitamin B3, phosphorus, zinc, vitamin E, magnesium, and folate than pudding. Candy bar's daily need coverage for vitamin B6 is 11767% higher. Pudding has 68 times less vitamin E than candy bar. Candy bar has 4.1mg of vitamin E, while pudding has 0.06mg. Pudding is lower in saturated fat. We used Candies, peanut bar and Puddings, chocolate, dry mix, regular, prepared with whole milk types in this comparison.
Infographic
Mineral Comparison
Mineral comparison score is based on the number of minerals by which one or the other food is richer. The "coverage" charts below show how much of the daily needs can be covered by 300 grams of the food.
8
100 g
300 g
1 oz - 28.35g 1 bar (1.4 oz) - 40g 1 bar (1.6 oz) - 45g 1 bar (1.75 fl oz) - 50g
Magnesium
Magnesium
Calcium
Calcium
Potassium
Potassium
Iron
Iron
Copper
Copper
Zinc
Zinc
Phosphorus
Phosphorus
Sodium
Sodium
Manganese
Manganese
Selenium
Selenium
79%
23%
36%
36%
258%
107%
132%
20%
162%
26%
2
100 g
300 g
0.5 cup - 142g 1 package yield (2 cups) - 570g
Magnesium
Magnesium
Calcium
Calcium
Potassium
Potassium
Iron
Iron
Copper
Copper
Zinc
Zinc
Phosphorus
Phosphorus
Sodium
Sodium
Manganese
Manganese
Selenium
Selenium
14%
32%
13%
13%
37%
13%
37%
13%
13%
20%
Vitamin Comparison
Vitamin comparison score is based on the number of vitamins by which one or the other food is richer. The "coverage" charts below show how much of the daily needs can be covered by 300 grams of the food.
6
100 g
300 g
1 oz - 28.35g 1 bar (1.4 oz) - 40g 1 bar (1.6 oz) - 45g 1 bar (1.75 fl oz) - 50g
Vitamin C
Vit. C
Vitamin D
Vit. D
Vitamin A
Vit. A
Vitamin E
Vit. E
Vitamin B1
Vit. B1
Vitamin B2
Vit. B2
Vitamin B3
Vit. B3
Vitamin B5
Vit. B5
Vitamin B6
Vit. B6
Vitamin B12
Vit. B12
Vitamin K
Vit. K
Folate
Folate
0%
0%
0%
82%
25%
32%
149%
50%
35308%
0%
0%
56%
5
100 g
300 g
0.5 cup - 142g 1 package yield (2 cups) - 570g
Vitamin C
Vit. C
Vitamin D
Vit. D
Vitamin A
Vit. A
Vitamin E
Vit. E
Vitamin B1
Vit. B1
Vitamin B2
Vit. B2
Vitamin B3
Vit. B3
Vitamin B5
Vit. B5
Vitamin B6
Vit. B6
Vitamin B12
Vit. B12
Vitamin K
Vit. K
Folate
Folate
0%
17%
13%
1.2%
9.5%
36%
2.5%
20%
6.9%
39%
0.75%
3%
All nutrients comparison - raw data values
Nutrient
DV% diff.
Vitamin B6
153mg
0.03mg
11767%
Copper
0.774mg
0.111mg
74%
Polyunsaturated fat
10.65g
0.18g
70%
Manganese
1.243mg
0.097mg
50%
Vitamin B3
7.922mg
0.133mg
49%
Fats
33.7g
3.15g
47%
Monounsaturated fat
16.721g
0.819g
40%
Phosphorus
308mg
87mg
32%
Zinc
3.94mg
0.48mg
31%
Vitamin E
4.1mg
0.06mg
27%
Protein
15.5g
3.16g
25%
Magnesium
110mg
20mg
21%
Calories
522kcal
120kcal
20%
Folate
75µg
4µg
18%
Fiber
4.1g
0.8g
13%
Vitamin B12
0µg
0.31µg
13%
Saturated fat
4.678g
1.81g
13%
Vitamin B5
0.83mg
0.326mg
10%
Carbs
47.4g
19.64g
9%
Potassium
407mg
150mg
8%
Iron
0.97mg
0.34mg
8%
Vitamin D*
0 IU
44 IU
6%
Vitamin D
0µg
1.1µg
6%
Vitamin B1
0.1mg
0.038mg
5%
Vitamin A
0µg
39µg
4%
Cholesterol
0mg
9mg
3%
Calcium
78mg
106mg
3%
Sodium
156mg
98mg
3%
Choline
29.4mg
11.3mg
3%
Selenium
4.7µg
3.7µg
2%
Vitamin B2
0.14mg
0.157mg
1%
Caffeine
0mg
2mg
1%
Protein per 100 calories
3g
2.6g
N/A
Calories per 10 g protein
337kcal
380kcal
N/A
Weight per 100 calories
19g
83g
N/A
Unsaturated / Saturated Fat ratio
5.9
0.55
N/A
Net carbs
43.3g
18.84g
N/A
Sugar
42.22g
11.96g
N/A
Vitamin K
0µg
0.3µg
0%
Tryptophan
0.149mg
0%
Threonine
0.52mg
0%
Isoleucine
0.534mg
0%
Leucine
0.986mg
0%
Lysine
0.545mg
0%
Methionine
0.185mg
0%
Phenylalanine
0.787mg
0%
Valine
0.638mg
0%
Histidine
0.385mg
0%
Macronutrient Comparison
Macronutrient breakdown side-by-side comparison
4
16%
34%
47%
2%
Protein:
15.5 g
Fats:
33.7 g
Carbs:
47.4 g
Water:
1.6 g
Other:
1.8 g
1
3%
3%
20%
73%
Protein:
3.16 g
Fats:
3.15 g
Carbs:
19.64 g
Water:
73.13 g
Other:
0.92 g
Contains
more
Protein Protein
+390.5%
Contains
more
Fats Fats
+969.8%
Contains
more
Carbs Carbs
+141.3%
Contains
more
Other Other
+95.7%
Contains
more
Water Water
+4470.6%
Fat Type Comparison
Fat type breakdown side-by-side comparison
2
15%
52%
33%
Saturated fat:
Sat. Fat
4.678 g
Monounsaturated fat:
Mono. Fat
16.721 g
Polyunsaturated fat:
Poly. Fat
10.65 g
1
64%
29%
6%
Saturated fat:
Sat. Fat
1.81 g
Monounsaturated fat:
Mono. Fat
0.819 g
Polyunsaturated fat:
Poly. Fat
0.18 g
Contains
more
Mono. Fat Monounsaturated fat
+1941.6%
Contains
more
Poly. Fat Polyunsaturated fat
+5816.7%
Contains
less
Sat. Fat Saturated fat
-61.3%