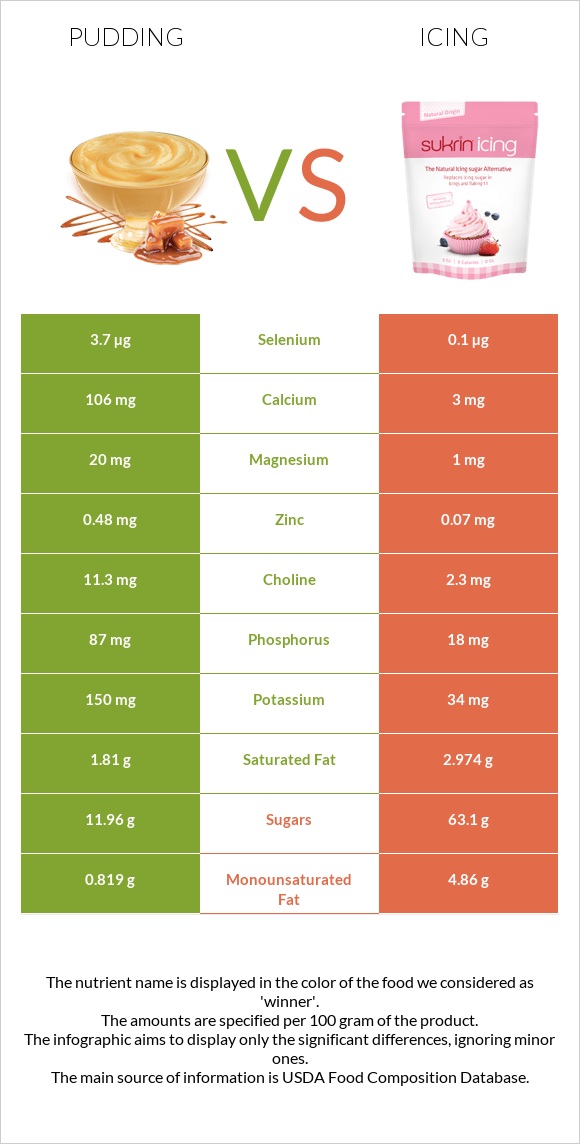
How are pudding and icing different? Pudding is higher in vitamin B12, copper, calcium, phosphorus, selenium, and vitamin D*; however, icing is richer in vitamin B2, vitamin K, and vitamin E. Daily need coverage for vitamin B12 for pudding is 13% higher. Pudding has less saturated fat. Puddings, chocolate, dry mix, regular, prepared with whole milk and Frostings, vanilla, creamy, ready-to-eat are the varieties used in this article.
Infographic
Mineral Comparison
Mineral comparison score is based on the number of minerals by which one or the other food is richer. The "coverage" charts below show how much of the daily needs can be covered by 300 grams of the food.
10
100 g
300 g
0.5 cup - 142g 1 package yield (2 cups) - 570g
Magnesium
Magnesium
Calcium
Calcium
Potassium
Potassium
Iron
Iron
Copper
Copper
Zinc
Zinc
Phosphorus
Phosphorus
Sodium
Sodium
Manganese
Manganese
Selenium
Selenium
14%
32%
13%
13%
37%
13%
37%
13%
13%
20%
0
100 g
300 g
2 tbsp creamy - 33g 0.083 package - 38g 1 package (16 oz) - 462g
Magnesium
Magnesium
Calcium
Calcium
Potassium
Potassium
Iron
Iron
Copper
Copper
Zinc
Zinc
Phosphorus
Phosphorus
Sodium
Sodium
Manganese
Manganese
Selenium
Selenium
0.71%
0.9%
3%
6%
0%
1.9%
7.7%
24%
0%
0.55%
Vitamin Comparison
Vitamin comparison score is based on the number of vitamins by which one or the other food is richer. The "coverage" charts below show how much of the daily needs can be covered by 300 grams of the food.
6
100 g
300 g
0.5 cup - 142g 1 package yield (2 cups) - 570g
Vitamin C
Vit. C
Vitamin D
Vit. D
Vitamin A
Vit. A
Vitamin E
Vit. E
Vitamin B1
Vit. B1
Vitamin B2
Vit. B2
Vitamin B3
Vit. B3
Vitamin B5
Vit. B5
Vitamin B6
Vit. B6
Vitamin B12
Vit. B12
Vitamin K
Vit. K
Folate
Folate
0%
17%
13%
1.2%
9.5%
36%
2.5%
20%
6.9%
39%
0.75%
3%
5
100 g
300 g
2 tbsp creamy - 33g 0.083 package - 38g 1 package (16 oz) - 462g
Vitamin C
Vit. C
Vitamin D
Vit. D
Vitamin A
Vit. A
Vitamin E
Vit. E
Vitamin B1
Vit. B1
Vitamin B2
Vit. B2
Vitamin B3
Vit. B3
Vitamin B5
Vit. B5
Vitamin B6
Vit. B6
Vitamin B12
Vit. B12
Vitamin K
Vit. K
Folate
Folate
0%
0%
0%
31%
2.5%
70%
4.1%
3.3%
0%
0%
33%
6%
All nutrients comparison - raw data values
Nutrient
DV% diff.
Polyunsaturated fat
0.18g
7.951g
52%
Fats
3.15g
16.23g
20%
Carbs
19.64g
67.89g
16%
Calories
120kcal
418kcal
15%
Vitamin B12
0.31µg
0µg
13%
Copper
0.111mg
0mg
12%
Vitamin B2
0.157mg
0.302mg
11%
Vitamin K
0.3µg
13µg
11%
Calcium
106mg
3mg
10%
Phosphorus
87mg
18mg
10%
Vitamin E
0.06mg
1.53mg
10%
Monounsaturated fat
0.819g
4.86g
10%
Selenium
3.7µg
0.1µg
7%
Protein
3.16g
0g
6%
Vitamin D*
44 IU
0 IU
6%
Vitamin D
1.1µg
0µg
6%
Magnesium
20mg
1mg
5%
Vitamin B5
0.326mg
0.055mg
5%
Saturated fat
1.81g
2.974g
5%
Zinc
0.48mg
0.07mg
4%
Sodium
98mg
184mg
4%
Vitamin A
39µg
0µg
4%
Manganese
0.097mg
0mg
4%
Cholesterol
9mg
0mg
3%
Potassium
150mg
34mg
3%
Fiber
0.8g
0g
3%
Iron
0.34mg
0.16mg
2%
Vitamin B1
0.038mg
0.01mg
2%
Vitamin B6
0.03mg
0mg
2%
Choline
11.3mg
2.3mg
2%
Vitamin B3
0.133mg
0.22mg
1%
Folate
4µg
8µg
1%
Caffeine
2mg
0mg
1%
Protein per 100 calories
2.6g
0g
N/A
Calories per 10 g protein
380kcal
N/A
Weight per 100 calories
83g
24g
N/A
Unsaturated / Saturated Fat ratio
0.55
4.3
N/A
Net carbs
18.84g
67.89g
N/A
Sugar
11.96g
63.1g
N/A
Macronutrient Comparison
Macronutrient breakdown side-by-side comparison
3
3%
3%
20%
73%
Protein:
3.16 g
Fats:
3.15 g
Carbs:
19.64 g
Water:
73.13 g
Other:
0.92 g
2
16%
68%
15%
Protein:
0 g
Fats:
16.23 g
Carbs:
67.89 g
Water:
15.07 g
Other:
0.81 g
Contains
more
Protein Protein
+∞%
Contains
more
Water Water
+385.3%
Contains
more
Other Other
+13.6%
Contains
more
Fats Fats
+415.2%
Contains
more
Carbs Carbs
+245.7%
Fat Type Comparison
Fat type breakdown side-by-side comparison
1
64%
29%
6%
Saturated fat:
Sat. Fat
1.81 g
Monounsaturated fat:
Mono. Fat
0.819 g
Polyunsaturated fat:
Poly. Fat
0.18 g
2
19%
31%
50%
Saturated fat:
Sat. Fat
2.974 g
Monounsaturated fat:
Mono. Fat
4.86 g
Polyunsaturated fat:
Poly. Fat
7.951 g
Contains
less
Sat. Fat Saturated fat
-39.1%
Contains
more
Mono. Fat Monounsaturated fat
+493.4%
Contains
more
Poly. Fat Polyunsaturated fat
+4317.2%