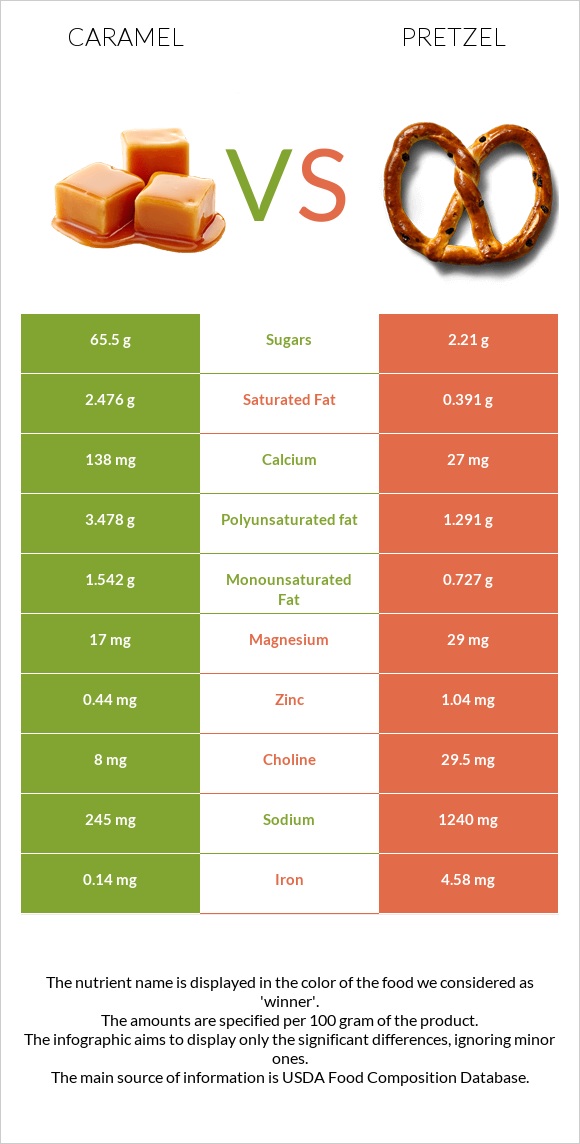
Differences between caramel and pretzel Caramel has more vitamin B12 and calcium, while pretzel has more iron, manganese, folate, vitamin B3, vitamin B1, copper, and fiber. Pretzel's daily need coverage for iron is 56% higher. The amount of sodium in caramel is lower. Caramel has a lower glycemic index. The glycemic index of caramel is 65, while the glycemic index of pretzel is 83. The food types used in this comparison are Candies, caramels and Snacks, pretzels, hard, plain, salted .
Infographic
Mineral Comparison
Mineral comparison score is based on the number of minerals by which one or the other food is richer. The "coverage" charts below show how much of the daily needs can be covered by 300 grams of the food.
2
100 g
300 g
1 piece - 10.1g 1 package (2.5 oz) - 71g
Magnesium
Magnesium
Calcium
Calcium
Potassium
Potassium
Iron
Iron
Copper
Copper
Zinc
Zinc
Phosphorus
Phosphorus
Sodium
Sodium
Manganese
Manganese
Selenium
Selenium
12%
41%
19%
5.3%
6%
12%
49%
32%
1.4%
9.8%
7
100 g
300 g
1 oz - 28.35g 10 twists - 60g
Magnesium
Magnesium
Calcium
Calcium
Potassium
Potassium
Iron
Iron
Copper
Copper
Zinc
Zinc
Phosphorus
Phosphorus
Sodium
Sodium
Manganese
Manganese
Selenium
Selenium
21%
8.1%
20%
172%
52%
28%
55%
162%
132%
24%
Vitamin Comparison
Vitamin comparison score is based on the number of vitamins by which one or the other food is richer. The "coverage" charts below show how much of the daily needs can be covered by 300 grams of the food.
3
100 g
300 g
1 piece - 10.1g 1 package (2.5 oz) - 71g
Vitamin C
Vit. C
Vitamin D
Vit. D
Vitamin A
Vit. A
Vitamin E
Vit. E
Vitamin B1
Vit. B1
Vitamin B2
Vit. B2
Vitamin B3
Vit. B3
Vitamin B5
Vit. B5
Vitamin B6
Vit. B6
Vitamin B12
Vit. B12
Vitamin K
Vit. K
Folate
Folate
1.3%
0%
4%
9.2%
26%
59%
2.8%
37%
13%
38%
4.5%
3%
7
100 g
300 g
1 oz - 28.35g 10 twists - 60g
Vitamin C
Vit. C
Vitamin D
Vit. D
Vitamin A
Vit. A
Vitamin E
Vit. E
Vitamin B1
Vit. B1
Vitamin B2
Vit. B2
Vitamin B3
Vit. B3
Vitamin B5
Vit. B5
Vitamin B6
Vit. B6
Vitamin B12
Vit. B12
Vitamin K
Vit. K
Folate
Folate
7%
0%
0%
9.4%
106%
77%
99%
19%
17%
0%
7%
125%
All nutrients comparison - raw data values
Nutrient
DV% diff.
Iron
0.14mg
4.58mg
56%
Manganese
0.011mg
1.015mg
44%
Sodium
245mg
1240mg
43%
Folate
4µg
166µg
41%
Vitamin B3
0.148mg
5.27mg
32%
Starch
72.58g
30%
Vitamin B1
0.103mg
0.424mg
27%
Copper
0.018mg
0.156mg
15%
Polyunsaturated fat
3.478g
1.291g
15%
Fiber
0g
3.4g
14%
Vitamin B12
0.3µg
0µg
13%
Protein
4.6g
10.04g
11%
Calcium
138mg
27mg
11%
Saturated fat
2.476g
0.391g
9%
Fats
8.1g
2.93g
8%
Vitamin B2
0.256mg
0.332mg
6%
Vitamin B5
0.62mg
0.322mg
6%
Zinc
0.44mg
1.04mg
5%
Selenium
1.8µg
4.4µg
5%
Choline
8mg
29.5mg
4%
Magnesium
17mg
29mg
3%
Vitamin C
0.4mg
2.1mg
2%
Cholesterol
7mg
0mg
2%
Phosphorus
114mg
128mg
2%
Monounsaturated fat
1.542g
0.727g
2%
Carbs
77g
80.39g
1%
Vitamin A
12µg
0µg
1%
Vitamin B6
0.056mg
0.074mg
1%
Vitamin K
1.8µg
2.8µg
1%
Calories
382kcal
384kcal
0%
Protein per 100 calories
1.2g
2.6g
N/A
Calories per 10 g protein
830kcal
382kcal
N/A
Weight per 100 calories
26g
26g
N/A
Unsaturated / Saturated Fat ratio
2
5.2
N/A
Net carbs
77g
76.99g
N/A
Potassium
214mg
223mg
0%
Sugar
65.5g
2.21g
N/A
Vitamin E
0.46mg
0.47mg
0%
Trans fat
0.004g
N/A
Tryptophan
0.06mg
0.097mg
0%
Threonine
0.192mg
0.25mg
0%
Isoleucine
0.258mg
0.407mg
0%
Leucine
0.417mg
0.757mg
0%
Lysine
0.338mg
0.257mg
0%
Methionine
0.107mg
0.177mg
0%
Phenylalanine
0.205mg
0.52mg
0%
Valine
0.285mg
0.48mg
0%
Histidine
0.115mg
0.22mg
0%
Fructose
0.31g
0%
Omega-3 - ALA
0.063g
N/A
Omega-6 - Gamma-linoleic acid
0.001g
N/A
Omega-6 - Linoleic acid
1.223g
N/A
Macronutrient Comparison
Macronutrient breakdown side-by-side comparison
2
5%
8%
77%
9%
2%
Protein:
4.6 g
Fats:
8.1 g
Carbs:
77 g
Water:
8.5 g
Other:
1.8 g
3
10%
3%
80%
3%
4%
Protein:
10.04 g
Fats:
2.93 g
Carbs:
80.39 g
Water:
3.13 g
Other:
3.51 g
Contains
more
Fats Fats
+176.5%
Contains
more
Water Water
+171.6%
Contains
more
Protein Protein
+118.3%
Contains
more
Other Other
+95%
Fat Type Comparison
Fat type breakdown side-by-side comparison
2
33%
21%
46%
Saturated fat:
Sat. Fat
2.476 g
Monounsaturated fat:
Mono. Fat
1.542 g
Polyunsaturated fat:
Poly. Fat
3.478 g
1
16%
30%
54%
Saturated fat:
Sat. Fat
0.391 g
Monounsaturated fat:
Mono. Fat
0.727 g
Polyunsaturated fat:
Poly. Fat
1.291 g
Contains
more
Mono. Fat Monounsaturated fat
+112.1%
Contains
more
Poly. Fat Polyunsaturated fat
+169.4%
Contains
less
Sat. Fat Saturated fat
-84.2%