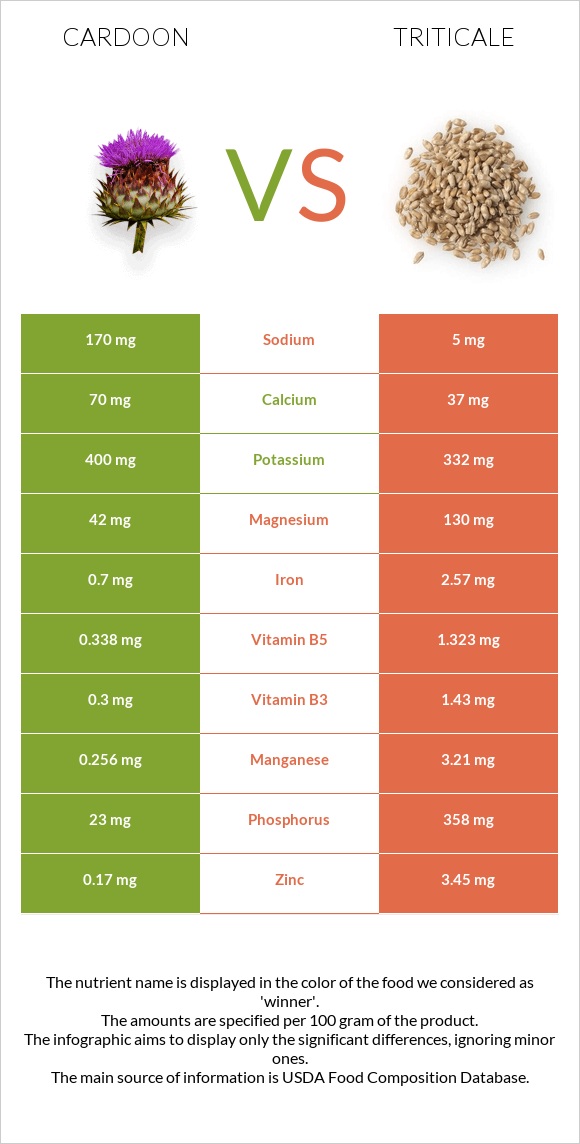
Differences between cardoon and triticale Cardoon contains less manganese, phosphorus, vitamin B1, zinc, copper, iron, magnesium, vitamin B5, and vitamin B2 than triticale. Triticale's daily need coverage for manganese is 128% higher. Triticale contains 34 times less sodium than cardoon. Cardoon contains 170mg of sodium, while triticale contains 5mg. The food types used in this comparison are Cardoon, raw and Triticale .
Infographic
Mineral Comparison
Mineral comparison score is based on the number of minerals by which one or the other food is richer. The "coverage" charts below show how much of the daily needs can be covered by 300 grams of the food.
3
100 g
300 g
1 cup, shredded - 178g
Magnesium
Magnesium
Calcium
Calcium
Potassium
Potassium
Iron
Iron
Copper
Copper
Zinc
Zinc
Phosphorus
Phosphorus
Sodium
Sodium
Manganese
Manganese
Selenium
Selenium
30%
21%
35%
26%
77%
4.6%
9.9%
22%
33%
1.1%
7
100 g
300 g
1 cup - 192g
Magnesium
Magnesium
Calcium
Calcium
Potassium
Potassium
Iron
Iron
Copper
Copper
Zinc
Zinc
Phosphorus
Phosphorus
Sodium
Sodium
Manganese
Manganese
Selenium
Selenium
93%
11%
29%
96%
152%
94%
153%
0.65%
419%
0%
Vitamin Comparison
Vitamin comparison score is based on the number of vitamins by which one or the other food is richer. The "coverage" charts below show how much of the daily needs can be covered by 300 grams of the food.
1
100 g
300 g
1 cup, shredded - 178g
Vitamin C
Vit. C
Vitamin D
Vit. D
Vitamin A
Vit. A
Vitamin E
Vit. E
Vitamin B1
Vit. B1
Vitamin B2
Vit. B2
Vitamin B3
Vit. B3
Vitamin B5
Vit. B5
Vitamin B6
Vit. B6
Vitamin B12
Vit. B12
Vitamin K
Vit. K
Folate
Folate
6.7%
0%
0%
0%
5%
6.9%
5.6%
20%
27%
0%
0%
51%
6
100 g
300 g
1 cup - 192g
Vitamin C
Vit. C
Vitamin D
Vit. D
Vitamin A
Vit. A
Vitamin E
Vit. E
Vitamin B1
Vit. B1
Vitamin B2
Vit. B2
Vitamin B3
Vit. B3
Vitamin B5
Vit. B5
Vitamin B6
Vit. B6
Vitamin B12
Vit. B12
Vitamin K
Vit. K
Folate
Folate
0%
0%
0%
18%
104%
31%
27%
79%
32%
0%
0%
55%
All nutrients comparison - raw data values
Nutrient
DV% diff.
Manganese
0.256mg
3.21mg
128%
Phosphorus
23mg
358mg
48%
Vitamin B1
0.02mg
0.416mg
33%
Zinc
0.17mg
3.45mg
30%
Protein
0.7g
13.05g
25%
Copper
0.231mg
0.457mg
25%
Carbs
4.07g
72.13g
23%
Iron
0.7mg
2.57mg
23%
Magnesium
42mg
130mg
21%
Vitamin B5
0.338mg
1.323mg
20%
Calories
17kcal
336kcal
16%
Vitamin B2
0.03mg
0.134mg
8%
Sodium
170mg
5mg
7%
Vitamin B3
0.3mg
1.43mg
7%
Fiber
1.6g
6%
Vitamin E
0.9mg
6%
Polyunsaturated fat
0.041g
0.913g
6%
Fats
0.1g
2.09g
3%
Calcium
70mg
37mg
3%
Vitamin C
2mg
0mg
2%
Potassium
400mg
332mg
2%
Vitamin B6
0.116mg
0.138mg
2%
Saturated fat
0.011g
0.366g
2%
Folate
68µg
73µg
1%
Protein per 100 calories
4.1g
3.9g
N/A
Calories per 10 g protein
243kcal
257kcal
N/A
Weight per 100 calories
588g
30g
N/A
Unsaturated / Saturated Fat ratio
5.4
3.1
N/A
Net carbs
2.47g
72.13g
N/A
Selenium
0.2µg
0%
Monounsaturated fat
0.018g
0.211g
0%
Tryptophan
0.157mg
0%
Threonine
0.405mg
0%
Isoleucine
0.479mg
0%
Leucine
0.911mg
0%
Lysine
0.365mg
0%
Methionine
0.204mg
0%
Phenylalanine
0.638mg
0%
Valine
0.609mg
0%
Histidine
0.311mg
0%
Macronutrient Comparison
Macronutrient breakdown side-by-side comparison
1
4%
94%
Protein:
0.7 g
Fats:
0.1 g
Carbs:
4.07 g
Water:
94 g
Other:
1.13 g
4
13%
2%
72%
11%
2%
Protein:
13.05 g
Fats:
2.09 g
Carbs:
72.13 g
Water:
10.51 g
Other:
2.22 g
Contains
more
Water Water
+794.4%
Contains
more
Protein Protein
+1764.3%
Contains
more
Fats Fats
+1990%
Contains
more
Carbs Carbs
+1672.2%
Contains
more
Other Other
+96.5%
Fat Type Comparison
Fat type breakdown side-by-side comparison
1
16%
26%
59%
Saturated fat:
Sat. Fat
0.011 g
Monounsaturated fat:
Mono. Fat
0.018 g
Polyunsaturated fat:
Poly. Fat
0.041 g
2
25%
14%
61%
Saturated fat:
Sat. Fat
0.366 g
Monounsaturated fat:
Mono. Fat
0.211 g
Polyunsaturated fat:
Poly. Fat
0.913 g
Contains
less
Sat. Fat Saturated fat
-97%
Contains
more
Mono. Fat Monounsaturated fat
+1072.2%
Contains
more
Poly. Fat Polyunsaturated fat
+2126.8%