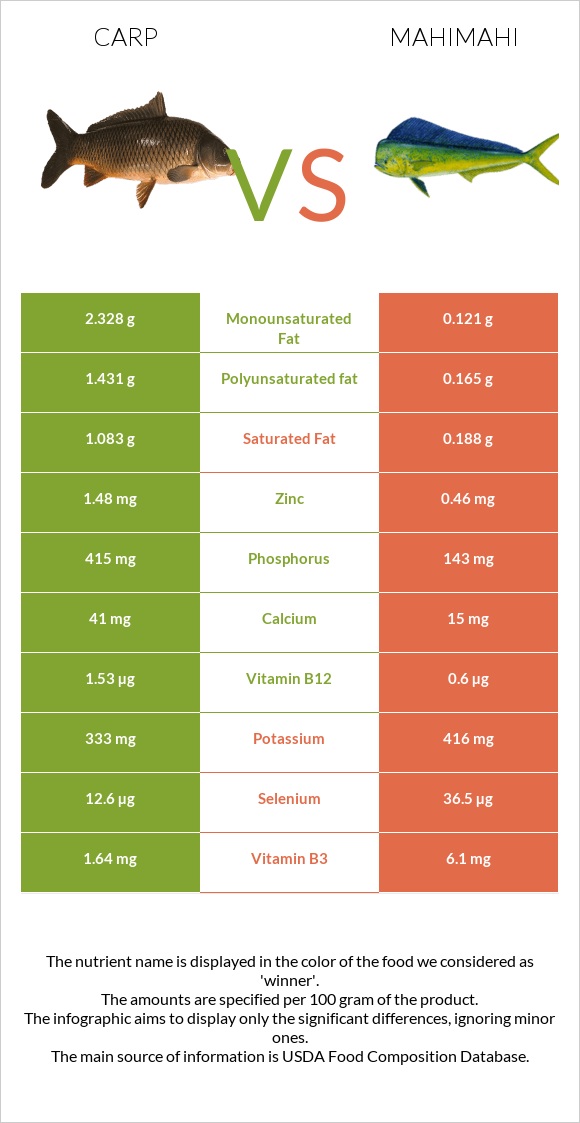
Important differences between carp and mahimahi Carp has more phosphorus, vitamin B12, zinc, vitamin B1, and iron; however, mahimahi has more selenium, vitamin B3, and vitamin B6. Carp's daily need coverage for phosphorus is 55% more. Carp has 7 times more saturated fat than mahimahi. Carp has 1.388g of saturated fat, while mahimahi has 0.188g. The food varieties used in the comparison are Fish, carp, cooked, dry heat and Fish, mahimahi, raw .
Infographic
Mineral Comparison
Mineral comparison score is based on the number of minerals by which one or the other food is richer. The "coverage" charts below show how much of the daily needs can be covered by 300 grams of the food.
8
100 g
300 g
3 oz - 85g 1 fillet - 170g
Magnesium
Magnesium
Calcium
Calcium
Potassium
Potassium
Iron
Iron
Copper
Copper
Zinc
Zinc
Phosphorus
Phosphorus
Sodium
Sodium
Manganese
Manganese
Selenium
Selenium
27%
16%
38%
60%
24%
52%
228%
8.2%
6.5%
88%
1
100 g
300 g
3 oz - 85g 1 fillet - 204g
Magnesium
Magnesium
Calcium
Calcium
Potassium
Potassium
Iron
Iron
Copper
Copper
Zinc
Zinc
Phosphorus
Phosphorus
Sodium
Sodium
Manganese
Manganese
Selenium
Selenium
21%
4.5%
37%
42%
14%
13%
61%
11%
2%
199%
Vitamin Comparison
Vitamin comparison score is based on the number of vitamins by which one or the other food is richer. The "coverage" charts below show how much of the daily needs can be covered by 300 grams of the food.
5
100 g
300 g
3 oz - 85g 1 fillet - 170g
Vitamin C
Vit. C
Vitamin D
Vit. D
Vitamin A
Vit. A
Vitamin E
Vit. E
Vitamin B1
Vit. B1
Vitamin B2
Vit. B2
Vitamin B3
Vit. B3
Vitamin B5
Vit. B5
Vitamin B6
Vit. B6
Vitamin B12
Vit. B12
Vitamin K
Vit. K
Folate
Folate
5.3%
0%
3.3%
0%
35%
16%
39%
52%
51%
184%
0%
13%
3
100 g
300 g
3 oz - 85g 1 fillet - 204g
Vitamin C
Vit. C
Vitamin D
Vit. D
Vitamin A
Vit. A
Vitamin E
Vit. E
Vitamin B1
Vit. B1
Vitamin B2
Vit. B2
Vitamin B3
Vit. B3
Vitamin B5
Vit. B5
Vitamin B6
Vit. B6
Vitamin B12
Vit. B12
Vitamin K
Vit. K
Folate
Folate
0%
0%
18%
0%
5%
16%
114%
45%
92%
75%
0%
3.8%
All nutrients comparison - raw data values
Nutrient
DV% diff.
Phosphorus
531mg
143mg
55%
Selenium
16.2µg
36.5µg
37%
Vitamin B12
1.47µg
0.6µg
36%
Vitamin B3
2.1mg
6.1mg
25%
Vitamin B6
0.219mg
0.4mg
14%
Zinc
1.9mg
0.46mg
13%
Polyunsaturated fat
1.835g
0.165g
11%
Fats
7.17g
0.7g
10%
Vitamin B1
0.14mg
0.02mg
10%
Protein
22.86g
18.5g
9%
Monounsaturated fat
2.985g
0.121g
7%
Iron
1.59mg
1.13mg
6%
Vitamin A
10µg
54µg
5%
Saturated fat
1.388g
0.188g
5%
Calories
162kcal
85kcal
4%
Cholesterol
84mg
73mg
4%
Calcium
52mg
15mg
4%
Copper
0.073mg
0.041mg
4%
Folate
17µg
5µg
3%
Vitamin C
1.6mg
0mg
2%
Magnesium
38mg
30mg
2%
Manganese
0.05mg
0.015mg
2%
Vitamin B5
0.87mg
0.75mg
2%
Sodium
63mg
88mg
1%
Protein per 100 calories
14g
22g
N/A
Calories per 10 g protein
71kcal
46kcal
N/A
Weight per 100 calories
62g
118g
N/A
Unsaturated / Saturated Fat ratio
3.5
1.5
N/A
Potassium
427mg
416mg
0%
Vitamin B2
0.07mg
0.07mg
0%
Tryptophan
0.256mg
0.207mg
0%
Threonine
1.002mg
0.811mg
0%
Isoleucine
1.054mg
0.852mg
0%
Leucine
1.858mg
1.504mg
0%
Lysine
2.1mg
1.699mg
0%
Methionine
0.677mg
0.548mg
0%
Phenylalanine
0.893mg
0.722mg
0%
Valine
1.178mg
0.953mg
0%
Histidine
0.673mg
0.545mg
0%
Omega-3 - EPA
0.305g
0.02g
N/A
Omega-3 - DHA
0.146g
0.088g
N/A
Omega-3 - DPA
0.105g
0.009g
N/A
Macronutrient Comparison
Macronutrient breakdown side-by-side comparison
2
23%
7%
70%
Protein:
22.86 g
Fats:
7.17 g
Carbs:
0 g
Water:
69.63 g
Other:
0.34 g
2
19%
78%
3%
Protein:
18.5 g
Fats:
0.7 g
Carbs:
0 g
Water:
77.55 g
Other:
3.25 g
Contains
more
Protein Protein
+23.6%
Contains
more
Fats Fats
+924.3%
Contains
more
Water Water
+11.4%
Contains
more
Other Other
+855.9%
Fat Type Comparison
Fat type breakdown side-by-side comparison
2
22%
48%
30%
Saturated fat:
Sat. Fat
1.388 g
Monounsaturated fat:
Mono. Fat
2.985 g
Polyunsaturated fat:
Poly. Fat
1.835 g
1
40%
26%
35%
Saturated fat:
Sat. Fat
0.188 g
Monounsaturated fat:
Mono. Fat
0.121 g
Polyunsaturated fat:
Poly. Fat
0.165 g
Contains
more
Mono. Fat Monounsaturated fat
+2366.9%
Contains
more
Poly. Fat Polyunsaturated fat
+1012.1%
Contains
less
Sat. Fat Saturated fat
-86.5%