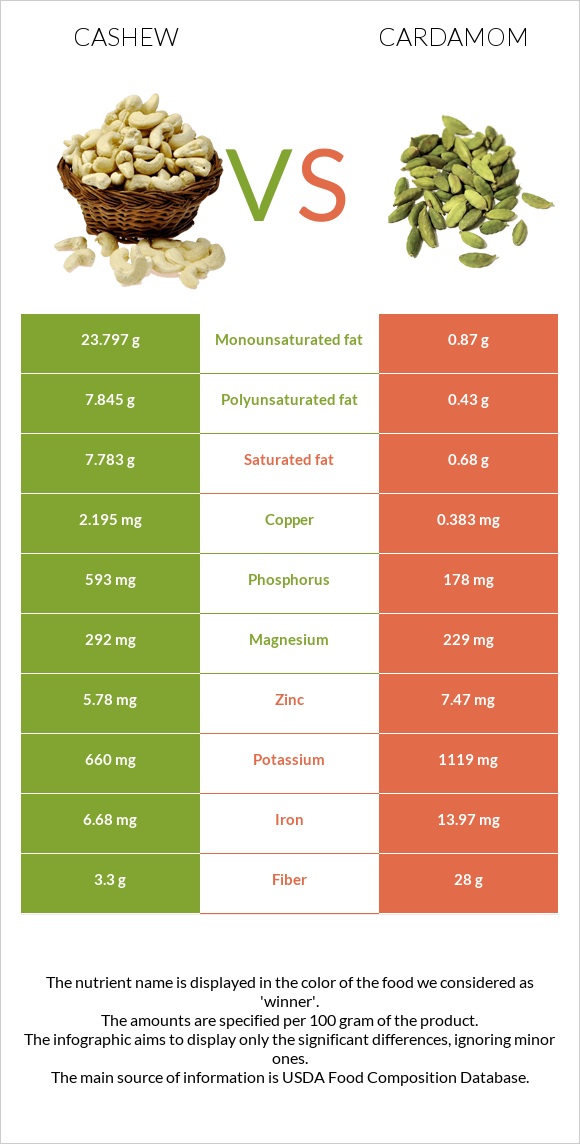
Summary of differences between cashew and cardamom Cashew has more copper, phosphorus, and vitamin B1; however, cardamom is higher in manganese, fiber, iron, calcium, vitamin C, and zinc. Cardamom covers your daily need for manganese, 1145% more than cashew. Cashew has 11 times more saturated fat than cardamom. While cashew has 7.783g of saturated fat, cardamom has only 0.68g. The glycemic index of cashew is higher. These are the specific foods used in this comparison Nuts, cashew nuts, raw and Spices, cardamom .
Infographic
Mineral Comparison
Mineral comparison score is based on the number of minerals by which one or the other food is richer. The "coverage" charts below show how much of the daily needs can be covered by 300 grams of the food.
5
100 g
300 g
1 oz - 28.35g
Magnesium
Magnesium
Calcium
Calcium
Potassium
Potassium
Iron
Iron
Copper
Copper
Zinc
Zinc
Phosphorus
Phosphorus
Sodium
Sodium
Manganese
Manganese
Selenium
Selenium
209%
11%
58%
251%
732%
158%
254%
1.6%
216%
109%
5
100 g
300 g
1 tsp, ground - 2g 1 tbsp, ground - 5.8g
Magnesium
Magnesium
Calcium
Calcium
Potassium
Potassium
Iron
Iron
Copper
Copper
Zinc
Zinc
Phosphorus
Phosphorus
Sodium
Sodium
Manganese
Manganese
Selenium
Selenium
164%
115%
99%
524%
128%
204%
76%
2.3%
3652%
0%
Vitamin Comparison
Vitamin comparison score is based on the number of vitamins by which one or the other food is richer. The "coverage" charts below show how much of the daily needs can be covered by 300 grams of the food.
6
100 g
300 g
1 oz - 28.35g
Vitamin C
Vit. C
Vitamin D
Vit. D
Vitamin A
Vit. A
Vitamin E
Vit. E
Vitamin B1
Vit. B1
Vitamin B2
Vit. B2
Vitamin B3
Vit. B3
Vitamin B5
Vit. B5
Vitamin B6
Vit. B6
Vitamin B12
Vit. B12
Vitamin K
Vit. K
Folate
Folate
1.7%
0%
0%
18%
106%
13%
20%
52%
96%
0%
85%
19%
2
100 g
300 g
1 tsp, ground - 2g 1 tbsp, ground - 5.8g
Vitamin C
Vit. C
Vitamin D
Vit. D
Vitamin A
Vit. A
Vitamin E
Vit. E
Vitamin B1
Vit. B1
Vitamin B2
Vit. B2
Vitamin B3
Vit. B3
Vitamin B5
Vit. B5
Vitamin B6
Vit. B6
Vitamin B12
Vit. B12
Vitamin K
Vit. K
Folate
Folate
70%
0%
0%
0%
50%
42%
21%
0%
53%
0%
0%
0%
All nutrients comparison - raw data values
Nutrient
DV% diff.
Manganese
1.655mg
28mg
1145%
Copper
2.195mg
0.383mg
201%
Fiber
3.3g
28g
99%
Iron
6.68mg
13.97mg
91%
Phosphorus
593mg
178mg
59%
Fats
43.85g
6.7g
57%
Monounsaturated fat
23.797g
0.87g
57%
Polyunsaturated fat
7.845g
0.43g
49%
Selenium
19.9µg
36%
Calcium
37mg
383mg
35%
Saturated fat
7.783g
0.68g
32%
Vitamin K
34.1µg
28%
Vitamin C
0.5mg
21mg
23%
Vitamin B1
0.423mg
0.198mg
19%
Vitamin B5
0.864mg
17%
Protein
18.22g
10.76g
15%
Magnesium
292mg
229mg
15%
Zinc
5.78mg
7.47mg
15%
Potassium
660mg
1119mg
14%
Vitamin B6
0.417mg
0.23mg
14%
Carbs
30.19g
68.47g
13%
Calories
553kcal
311kcal
12%
Starch
23.49g
10%
Vitamin B2
0.058mg
0.182mg
10%
Vitamin E
0.9mg
6%
Folate
25µg
6%
Protein per 100 calories
3.3g
3.5g
N/A
Calories per 10 g protein
304kcal
289kcal
N/A
Weight per 100 calories
18g
32g
N/A
Unsaturated / Saturated Fat ratio
4.1
1.9
N/A
Net carbs
26.89g
40.47g
N/A
Sugar
5.91g
N/A
Sodium
12mg
18mg
0%
Vitamin B3
1.062mg
1.102mg
0%
Tryptophan
0.287mg
0%
Threonine
0.688mg
0%
Isoleucine
0.789mg
0%
Leucine
1.472mg
0%
Lysine
0.928mg
0%
Methionine
0.362mg
0%
Phenylalanine
0.951mg
0%
Valine
1.094mg
0%
Histidine
0.456mg
0%
Fructose
0.05g
0%
Macronutrient Comparison
Macronutrient breakdown side-by-side comparison
2
18%
44%
30%
5%
3%
Protein:
18.22 g
Fats:
43.85 g
Carbs:
30.19 g
Water:
5.2 g
Other:
2.54 g
3
11%
7%
68%
8%
6%
Protein:
10.76 g
Fats:
6.7 g
Carbs:
68.47 g
Water:
8.28 g
Other:
5.79 g
Contains
more
Protein Protein
+69.3%
Contains
more
Fats Fats
+554.5%
Contains
more
Carbs Carbs
+126.8%
Contains
more
Water Water
+59.2%
Contains
more
Other Other
+128%
Fat Type Comparison
Fat type breakdown side-by-side comparison
2
20%
60%
20%
Saturated fat:
Sat. Fat
7.783 g
Monounsaturated fat:
Mono. Fat
23.797 g
Polyunsaturated fat:
Poly. Fat
7.845 g
1
34%
44%
22%
Saturated fat:
Sat. Fat
0.68 g
Monounsaturated fat:
Mono. Fat
0.87 g
Polyunsaturated fat:
Poly. Fat
0.43 g
Contains
more
Mono. Fat Monounsaturated fat
+2635.3%
Contains
more
Poly. Fat Polyunsaturated fat
+1724.4%
Contains
less
Sat. Fat Saturated fat
-91.3%