Cardamom vs. Cinnamon — Health Impact and Nutrition Comparison


Summary
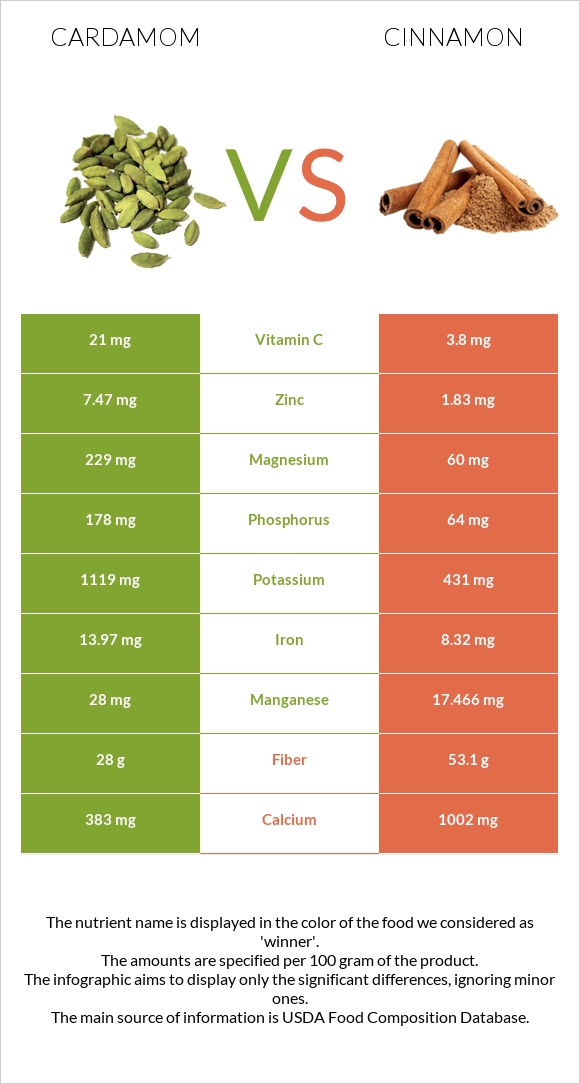
Cardamom is a more expensive spice compared to cinnamon. It is richer in zinc, potassium, phosphorus, magnesium, copper, and vitamins C, B1, B6. Comparatively, cinnamon is richer in fibers, vitamins K, E, B2, B5, and A. They have antioxidative, antidiabetic, cardioprotective, anticarcinogenic properties.
Introduction
Cardamom is a spice that is harvested as small green seeds. It is initially harvested in Asian countries, specifically India and Indonesia. Nowadays, with the spread of agriculture, Guatemala is the highest producer of cardamom, followed by India.
On the other hand, we have cinnamon, a different type of spice. The origin of cinnamon traces back to ancient China. It comes from the inner bark of a dried-up cinnamon wood tree. Also, it could be found in powder form. Its essential flavor comes from cinnamaldehyde which is an oil extracted from it. Indonesia and China produce 70% of cinnamon around the world.
In this article, bare compared to each other, considering their general differences, nutritional content, and health impacts.
General differences
What are the actual differences between cardamom and cinnamon?
The general differences that we consider are availability, price, and culinary usage.
Availability
Cardamom and cinnamon are mostly available globally and during all seasons. Although, we can add that cinnamon is more distributed in all households than cardamon.
Price
Cardamon is one of the most expensive spices, and it is ranked 3rd in expensiveness after saffron and vanilla. On the other hand, cinnamon is a cheaper spice compared to cardamon.
Culinary usage
Cardamom is used for various reasons. It can be used in cooking. One of the most famous usages of cardamon is combined with coffee in the Arab world.
On the other hand, cinnamon is widely used in middle eastern cuisine. It also has a combination of a hot beverage, cinnamon, and black tea. A famous usage of cinnamon powder is cinnamon rolls. However, they are loaded with sugars.
Nutritional content comparison
The nutritional content comparison will cover the differences in calories, glycemic index, macronutrients, and micronutrients for cardamom and cinnamon.
The serving sizes are 1 tsp for each. The serving size of cardamom is equivalent to 2g and for cinnamon is 2.6g.
Calories
Cardamom contains higher amounts of calories than cinnamon. However, when considering their serving sizes, these are around 6-7 calories.
Carbohydrates
Cinnamon contains higher carb amounts as compared to cardamom. However, this carb amount is mostly due to the fact that cinnamon is high in fibers.
Fibers
The fiber content of cinnamon is almost double the amount of that in cardamon.
Protein and fat
Cardamom contains higher amounts of both protein and fats. However, when we take into consideration, the serving size of each of these numbers is negligible.
Minerals
Cardamom has a richer mineral profile compared to cinnamon.
Cardamom is richer in zinc, potassium, phosphorus, magnesium, and copper.
On the other hand, cinnamon is richer in calcium levels.
It is important to mention that cinnamon contains high amounts of zinc, iron, potassium. However, comparatively, cardamom contains more.
Mineral Comparison
Contains
more
MagnesiumMagnesium
+281.7%
Contains
more
PotassiumPotassium
+159.6%
Contains
more
IronIron
+67.9%
Contains
more
CopperCopper
+13%
Contains
more
ZincZinc
+308.2%
Contains
more
PhosphorusPhosphorus
+178.1%
Contains
more
ManganeseManganese
+60.3%
Contains
more
CalciumCalcium
+161.6%
Contains
less
SodiumSodium
-44.4%
Vitamins
When it comes to the vitamin profile, cinnamon is richer in vitamins.
Cinnamon is richer in vitamins K, E, B2, B5, and A.
On the other hand, cardamom is richer in vitamins C, B1, B6.
Vitamin Comparison
Contains
more
Vitamin CVitamin C
+452.6%
Contains
more
Vitamin B1Vitamin B1
+800%
Contains
more
Vitamin B2Vitamin B2
+343.9%
Contains
more
Vitamin B6Vitamin B6
+45.6%
Contains
more
Vitamin AVitamin A
+∞%
Contains
more
Vitamin B3Vitamin B3
+20.9%
Health impacts
Antioxidant
Cardamom contains phytochemicals that reduce overall levels of free radicals in the system. In addition to that, these compounds have anti-inflammatory properties. They reduce overall levels of chronic inflammatory cytokines. (1)
Phenolic compounds in cinnamon contribute to their antioxidative activities by scavenging free radicals and maintaining antioxidative enzymes to keep free radical levels in low amounts. (2)
Cardiovascular health
Cardamom extracts, in concentrated amounts, have calcium channel blocking activity that acts in blood pressure regulation. In addition to that, it also has diuretic effects, which also act to reduce pressure in hypertensive people. (3)
Cinnamaldehyde present in cinnamon has vasodilatory effects, an important property to reduce blood pressure in hypertensive people. (2)
Both cardamom and cinnamon have beneficial effects on the cardiovascular system, which is the immediate improvement of hypertension cases; however, they have different mechanisms.
Cancer
As we mentioned before, cardamom phytochemicals that have antioxidative properties have a benefit in cancer. These compounds have chemopreventive characteristics against being skin cancer-like papillomas. (4) (5)
Cinnamon extracted phenols have protective roles against hematological cancers. They suppress cells to further transform into cancer cells. (6)
The antioxidative properties of cinnamon extract have protective functions against colorectal cancer. (7)
Diabetes
Cardamom extracts have hepatoprotective functions in diabetes. In addition to that, it prevents dyslipidemia which decreases the risks of atherosclerosis and cardiac diseases. (8)
Cinnamon intake during type 2 diabetes shows improvement in blood glucose and lipids levels, which means decreased risks of diabetic complications, mainly in the cardiovascular system. (9) (10)
Digestive tract
Animal studies have shown cardamom may have gastroprotective effects and beneficially affect gastric ulcers. It may help improve the stomach mucous layer, partake in ulcer healing, or at least prevent further ulcer progression. (11) (12)
In animal studies, cinnamon has been shown to reduce intestinal inflammation in animals with colitis. (13) (14)
Neurodegenerative
Cardamom extracts cineole have protective characteristics in the prevention of Alzheimer's disease. (15)
Cinnamon extracts have neuroprotective properties against Alzheimer's and Parkinson's disease. (16) (17)
References
- https://pubmed.ncbi.nlm.nih.gov/28458157/
- https://www.ncbi.nlm.nih.gov/pmc/articles/PMC4003790/
- https://pubmed.ncbi.nlm.nih.gov/18037596/
- https://pubmed.ncbi.nlm.nih.gov/22404574/
- https://pubmed.ncbi.nlm.nih.gov/22182368/
- https://pubmed.ncbi.nlm.nih.gov/16253769/
- https://pubmed.ncbi.nlm.nih.gov/18260732/
- https://www.ncbi.nlm.nih.gov/pmc/articles/PMC5557534/
- https://pubmed.ncbi.nlm.nih.gov/14633804/
- https://pubmed.ncbi.nlm.nih.gov/24019277/
- https://pubmed.ncbi.nlm.nih.gov/16298093/
- https://pubmed.ncbi.nlm.nih.gov/11297839/
- https://pubmed.ncbi.nlm.nih.gov/28324642/
- https://pubmed.ncbi.nlm.nih.gov/21451725/
- https://link.springer.com/article/10.1007/s12017-019-08574-2
- https://pubmed.ncbi.nlm.nih.gov/19433898/
- https://pubmed.ncbi.nlm.nih.gov/24946862/

Infographic
All nutrients comparison - raw data values
| Nutrient | |
|
DV% diff. |
| Manganese | 28mg | 17.466mg | 458% |
| Fiber | 28g | 53.1g | 100% |
| Iron | 13.97mg | 8.32mg | 71% |
| Calcium | 383mg | 1002mg | 62% |
| Zinc | 7.47mg | 1.83mg | 51% |
| Magnesium | 229mg | 60mg | 40% |
| Vitamin K | 31.2µg | 26% | |
| Potassium | 1119mg | 431mg | 20% |
| Vitamin C | 21mg | 3.8mg | 19% |
| Phosphorus | 178mg | 64mg | 16% |
| Vitamin E | 2.32mg | 15% | |
| Vitamin B1 | 0.198mg | 0.022mg | 15% |
| Protein | 10.76g | 3.99g | 14% |
| Vitamin B2 | 0.182mg | 0.041mg | 11% |
| Fats | 6.7g | 1.24g | 8% |
| Vitamin B5 | 0.358mg | 7% | |
| Selenium | 3.1µg | 6% | |
| Vitamin B6 | 0.23mg | 0.158mg | 6% |
| Copper | 0.383mg | 0.339mg | 5% |
| Carbs | 68.47g | 80.59g | 4% |
| Calories | 311kcal | 247kcal | 3% |
| Vitamin A | 0µg | 15µg | 2% |
| Folate | 6µg | 2% | |
| Choline | 11mg | 2% | |
| Saturated fat | 0.68g | 0.345g | 2% |
| Monounsaturated fat | 0.87g | 0.246g | 2% |
| Polyunsaturated fat | 0.43g | 0.068g | 2% |
| Vitamin B3 | 1.102mg | 1.332mg | 1% |
| Fructose | 1.11g | 1% | |
| Protein per 100 calories | 3.5g | 1.6g | N/A |
| Calories per 10 g protein | 289kcal | 619kcal | N/A |
| Weight per 100 calories | 32g | 40g | N/A |
| Unsaturated / Saturated Fat ratio | 1.9 | 0.91 | N/A |
| Net carbs | 40.47g | 27.49g | N/A |
| Sugar | 2.17g | N/A | |
| Sodium | 18mg | 10mg | 0% |
| Tryptophan | 0.049mg | 0% | |
| Threonine | 0.136mg | 0% | |
| Isoleucine | 0.146mg | 0% | |
| Leucine | 0.253mg | 0% | |
| Lysine | 0.243mg | 0% | |
| Methionine | 0.078mg | 0% | |
| Phenylalanine | 0.146mg | 0% | |
| Valine | 0.224mg | 0% | |
| Histidine | 0.117mg | 0% | |
| Omega-3 - ALA | 0.011g | N/A |
Macronutrient Comparison
| Contains more ProteinProtein | +169.7% |
| Contains more FatsFats | +440.3% |
| Contains more OtherOther | +60.8% |
| Contains more CarbsCarbs | +17.7% |
| Contains more WaterWater | +27.8% |
Fat Type Comparison
| Contains more Mono. FatMonounsaturated fat | +253.7% |
| Contains more Poly. FatPolyunsaturated fat | +532.4% |
| Contains less Sat. FatSaturated fat | -49.3% |
People also compare


References
All the values for which the sources are not specified explicitly are taken from FDA’s Food Central. The exact link to the food presented on this page can be found below.
- Cardamom - https://fdc.nal.usda.gov/fdc-app.html#/food-details/170919/nutrients
- Cinnamon - https://fdc.nal.usda.gov/fdc-app.html#/food-details/171320/nutrients
All the Daily Values are presented for males aged 31-50, for 2000-calorie diets.