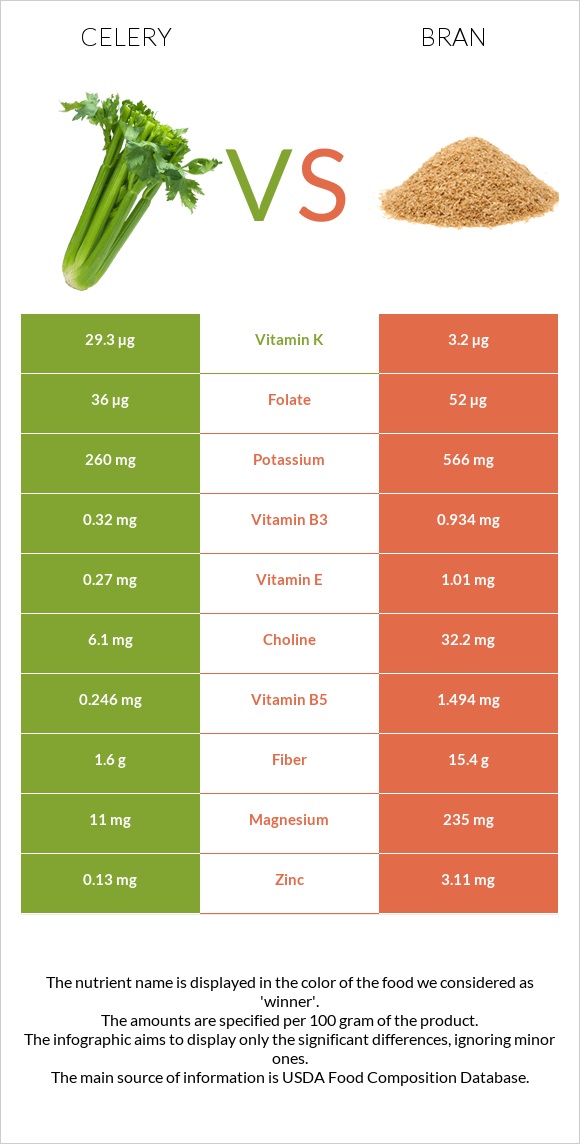
What are the differences between celery and bran? Celery is higher in vitamin A and folate, yet bran is higher in manganese, phosphorus, selenium, vitamin B1, iron, and magnesium. Bran's daily need coverage for manganese is 37% more. The glycemic index of celery is lower. We used Celery, raw and Oat bran, cooked types in this article.
Infographic
Mineral Comparison
Mineral comparison score is based on the number of minerals by which one or the other food is richer. The "coverage" charts below show how much of the daily needs can be covered by 300 grams of the food.
2
100 g
300 g
1 strip (4" long) - 4g 1 tbsp - 7.5g 1 stalk, small (5" long) - 17g 1 stalk, medium (7-1/2" - 8" long) - 40g 1 stalk, large (11"-12" long) - 64g 1 cup chopped - 101g 1 NLEA serving - 110g
Magnesium
Magnesium
Calcium
Calcium
Potassium
Potassium
Iron
Iron
Copper
Copper
Zinc
Zinc
Phosphorus
Phosphorus
Sodium
Sodium
Manganese
Manganese
Selenium
Selenium
7.9%
12%
23%
7.5%
12%
3.5%
10%
10%
13%
2.2%
8
100 g
300 g
1 cup - 219g
Magnesium
Magnesium
Calcium
Calcium
Potassium
Potassium
Iron
Iron
Copper
Copper
Zinc
Zinc
Phosphorus
Phosphorus
Sodium
Sodium
Manganese
Manganese
Selenium
Selenium
29%
3%
8.1%
33%
22%
14%
51%
0.13%
126%
42%
Vitamin Comparison
Vitamin comparison score is based on the number of vitamins by which one or the other food is richer. The "coverage" charts below show how much of the daily needs can be covered by 300 grams of the food.
9
100 g
300 g
1 strip (4" long) - 4g 1 tbsp - 7.5g 1 stalk, small (5" long) - 17g 1 stalk, medium (7-1/2" - 8" long) - 40g 1 stalk, large (11"-12" long) - 64g 1 cup chopped - 101g 1 NLEA serving - 110g
Vitamin C
Vit. C
Vitamin D
Vit. D
Vitamin A
Vit. A
Vitamin E
Vit. E
Vitamin B1
Vit. B1
Vitamin B2
Vit. B2
Vitamin B3
Vit. B3
Vitamin B5
Vit. B5
Vitamin B6
Vit. B6
Vitamin B12
Vit. B12
Vitamin K
Vit. K
Folate
Folate
10%
0%
7.3%
5.4%
5.3%
13%
6%
15%
17%
0%
73%
27%
1
100 g
300 g
1 cup - 219g
Vitamin C
Vit. C
Vitamin D
Vit. D
Vitamin A
Vit. A
Vitamin E
Vit. E
Vitamin B1
Vit. B1
Vitamin B2
Vit. B2
Vitamin B3
Vit. B3
Vitamin B5
Vit. B5
Vitamin B6
Vit. B6
Vitamin B12
Vit. B12
Vitamin K
Vit. K
Folate
Folate
0%
0%
0%
0%
40%
7.8%
2.7%
13%
5.8%
0%
0%
4.5%
All nutrients comparison - raw data values
Nutrient
DV% diff.
Manganese
0.103mg
0.964mg
37%
Vitamin K
29.3µg
24%
Phosphorus
24mg
119mg
14%
Selenium
0.4µg
7.7µg
13%
Vitamin B1
0.021mg
0.16mg
12%
Iron
0.2mg
0.88mg
9%
Folate
36µg
6µg
8%
Magnesium
11mg
40mg
7%
Protein
0.69g
3.21g
5%
Potassium
260mg
92mg
5%
Fiber
1.6g
2.6g
4%
Zinc
0.13mg
0.53mg
4%
Vitamin B6
0.074mg
0.025mg
4%
Vitamin C
3.1mg
0mg
3%
Carbs
2.97g
11.44g
3%
Calcium
40mg
10mg
3%
Copper
0.035mg
0.066mg
3%
Sodium
80mg
1mg
3%
Vitamin A
22µg
0µg
2%
Vitamin E
0.27mg
2%
Vitamin B2
0.057mg
0.034mg
2%
Polyunsaturated fat
0.079g
0.339g
2%
Calories
16kcal
40kcal
1%
Fats
0.17g
0.86g
1%
Vitamin B3
0.32mg
0.144mg
1%
Vitamin B5
0.246mg
0.217mg
1%
Choline
6.1mg
1%
Saturated fat
0.042g
0.163g
1%
Monounsaturated fat
0.032g
0.291g
1%
Protein per 100 calories
4.3g
8g
N/A
Calories per 10 g protein
232kcal
125kcal
N/A
Weight per 100 calories
625g
250g
N/A
Net carbs
1.37g
8.84g
N/A
Sugar
1.34g
N/A
Tryptophan
0.009mg
0.057mg
0%
Threonine
0.02mg
0.086mg
0%
Isoleucine
0.021mg
0.114mg
0%
Leucine
0.032mg
0.235mg
0%
Lysine
0.027mg
0.13mg
0%
Methionine
0.005mg
0.057mg
0%
Phenylalanine
0.02mg
0.155mg
0%
Valine
0.027mg
0.165mg
0%
Histidine
0.012mg
0.07mg
0%
Fructose
0.37g
0%
Macronutrient Comparison
Macronutrient breakdown side-by-side comparison
2
3%
95%
Protein:
0.69 g
Fats:
0.17 g
Carbs:
2.97 g
Water:
95.43 g
Other:
0.74 g
3
3%
11%
84%
Protein:
3.21 g
Fats:
0.86 g
Carbs:
11.44 g
Water:
84 g
Other:
0.49 g
Contains
more
Water Water
+13.6%
Contains
more
Other Other
+51%
Contains
more
Protein Protein
+365.2%
Contains
more
Fats Fats
+405.9%
Contains
more
Carbs Carbs
+285.2%
Fat Type Comparison
Fat type breakdown side-by-side comparison
1
27%
21%
52%
Saturated fat:
Sat. Fat
0.042 g
Monounsaturated fat:
Mono. Fat
0.032 g
Polyunsaturated fat:
Poly. Fat
0.079 g
2
21%
37%
43%
Saturated fat:
Sat. Fat
0.163 g
Monounsaturated fat:
Mono. Fat
0.291 g
Polyunsaturated fat:
Poly. Fat
0.339 g
Contains
less
Sat. Fat Saturated fat
-74.2%
Contains
more
Mono. Fat Monounsaturated fat
+809.4%
Contains
more
Poly. Fat Polyunsaturated fat
+329.1%