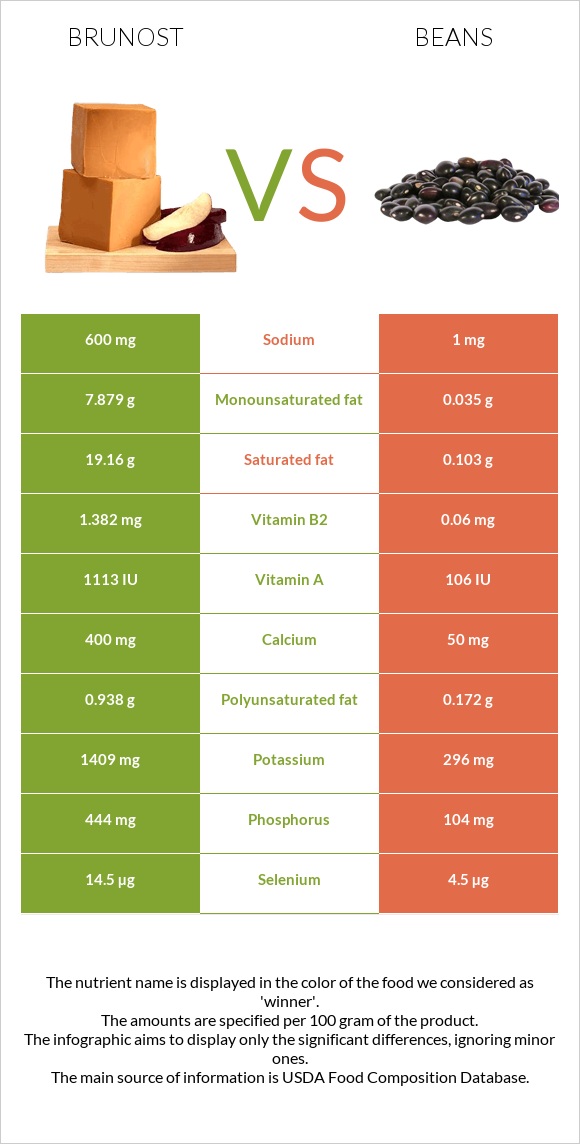
Significant differences between brunost and beans Brunost has more vitamin B2, vitamin B12, phosphorus, calcium, potassium, and vitamin A; however, beans are richer in fiber. Brunost covers your daily vitamin B2 needs 102% more than beans. Beans contain less cholesterol. Specific food types used in this comparison are Cheese, gjetost and Beans, baked, canned, no salt added .
Infographic
Mineral Comparison
Mineral comparison score is based on the number of minerals by which one or the other food is richer. The "coverage" charts below show how much of the daily needs can be covered by 300 grams of the food.
7
100 g
300 g
1 oz - 28.35g 1 package (8 oz) - 227g
Magnesium
Magnesium
Calcium
Calcium
Potassium
Potassium
Iron
Iron
Copper
Copper
Zinc
Zinc
Phosphorus
Phosphorus
Sodium
Sodium
Manganese
Manganese
Selenium
Selenium
50%
120%
124%
20%
27%
31%
190%
78%
5.2%
79%
3
100 g
300 g
1 cup - 253g
Magnesium
Magnesium
Calcium
Calcium
Potassium
Potassium
Iron
Iron
Copper
Copper
Zinc
Zinc
Phosphorus
Phosphorus
Sodium
Sodium
Manganese
Manganese
Selenium
Selenium
23%
15%
26%
11%
69%
38%
45%
0.13%
0%
25%
Vitamin Comparison
Vitamin comparison score is based on the number of vitamins by which one or the other food is richer. The "coverage" charts below show how much of the daily needs can be covered by 300 grams of the food.
7
100 g
300 g
1 oz - 28.35g 1 package (8 oz) - 227g
Vitamin C
Vit. C
Vitamin D
Vit. D
Vitamin A
Vit. A
Vitamin E
Vit. E
Vitamin B1
Vit. B1
Vitamin B2
Vit. B2
Vitamin B3
Vit. B3
Vitamin B5
Vit. B5
Vitamin B6
Vit. B6
Vitamin B12
Vit. B12
Vitamin K
Vit. K
Folate
Folate
0%
0%
111%
0%
79%
319%
15%
201%
63%
303%
0%
3.8%
4
100 g
300 g
1 cup - 253g
Vitamin C
Vit. C
Vitamin D
Vit. D
Vitamin A
Vit. A
Vitamin E
Vit. E
Vitamin B1
Vit. B1
Vitamin B2
Vit. B2
Vitamin B3
Vit. B3
Vitamin B5
Vit. B5
Vitamin B6
Vit. B6
Vitamin B12
Vit. B12
Vitamin K
Vit. K
Folate
Folate
10%
0%
1.7%
3%
38%
14%
8.1%
0%
30%
0%
2%
18%
All nutrients comparison - raw data values
Nutrient
DV% diff.
Vitamin B2
1.382mg
0.06mg
102%
Vitamin B12
2.42µg
0µg
101%
Saturated fat
19.16g
0.103g
87%
Vitamin B5
3.351mg
67%
Phosphorus
444mg
104mg
49%
Fats
29.51g
0.4g
45%
Vitamin A
334µg
5µg
37%
Calcium
400mg
50mg
35%
Potassium
1409mg
296mg
33%
Cholesterol
94mg
0mg
31%
Sodium
600mg
1mg
26%
Fiber
0g
5.5g
22%
Monounsaturated fat
7.879g
0.035g
20%
Calories
466kcal
105kcal
18%
Selenium
14.5µg
4.5µg
18%
Copper
0.08mg
0.206mg
14%
Vitamin B1
0.315mg
0.15mg
14%
Vitamin B6
0.271mg
0.13mg
11%
Protein
9.65g
4.8g
10%
Magnesium
70mg
32mg
9%
Carbs
42.65g
20.49g
7%
Choline
30.8mg
6%
Folate
5µg
24µg
5%
Polyunsaturated fat
0.938g
0.172g
5%
Vitamin C
0mg
3.1mg
3%
Iron
0.52mg
0.29mg
3%
Zinc
1.14mg
1.4mg
2%
Manganese
0.04mg
2%
Vitamin B3
0.813mg
0.43mg
2%
Vitamin E
0.15mg
1%
Vitamin K
0.8µg
1%
Protein per 100 calories
2.1g
4.6g
N/A
Calories per 10 g protein
483kcal
219kcal
N/A
Weight per 100 calories
21g
95g
N/A
Unsaturated / Saturated Fat ratio
0.46
2
N/A
Net carbs
42.65g
14.99g
N/A
Sugar
7.78g
N/A
Tryptophan
0.135mg
0%
Threonine
0.393mg
0%
Isoleucine
0.519mg
0%
Leucine
0.992mg
0%
Lysine
0.814mg
0%
Methionine
0.318mg
0%
Phenylalanine
0.54mg
0%
Valine
0.765mg
0%
Histidine
0.293mg
0%
Macronutrient Comparison
Macronutrient breakdown side-by-side comparison
4
10%
30%
43%
13%
5%
Protein:
9.65 g
Fats:
29.51 g
Carbs:
42.65 g
Water:
13.44 g
Other:
4.75 g
1
5%
20%
73%
2%
Protein:
4.8 g
Fats:
0.4 g
Carbs:
20.49 g
Water:
72.6 g
Other:
1.71 g
Contains
more
Protein Protein
+101%
Contains
more
Fats Fats
+7277.5%
Contains
more
Carbs Carbs
+108.2%
Contains
more
Other Other
+177.8%
Contains
more
Water Water
+440.2%
Fat Type Comparison
Fat type breakdown side-by-side comparison
2
68%
28%
3%
Saturated fat:
Sat. Fat
19.16 g
Monounsaturated fat:
Mono. Fat
7.879 g
Polyunsaturated fat:
Poly. Fat
0.938 g
1
33%
11%
55%
Saturated fat:
Sat. Fat
0.103 g
Monounsaturated fat:
Mono. Fat
0.035 g
Polyunsaturated fat:
Poly. Fat
0.172 g
Contains
more
Mono. Fat Monounsaturated fat
+22411.4%
Contains
more
Poly. Fat Polyunsaturated fat
+445.3%
Contains
less
Sat. Fat Saturated fat
-99.5%