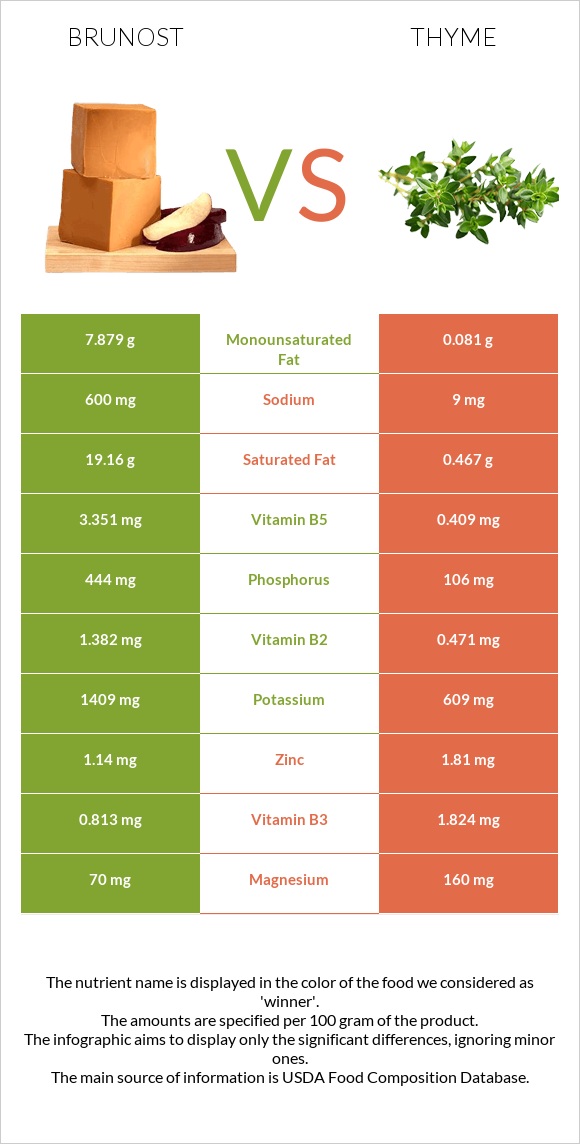
Significant differences between brunost and thyme Brunost has more vitamin B12, vitamin B2, and vitamin B5; however, thyme is richer in iron, vitamin C, manganese, vitamin A, fiber, and copper. Thyme covers your daily iron needs 212% more than brunost. Thyme contains less saturated fat. Thyme has a higher glycemic index. The glycemic index of thyme is 45, while the glycemic index of brunost is 27. Specific food types used in this comparison are Cheese, gjetost and Thyme, fresh .
Infographic
Mineral Comparison
Mineral comparison score is based on the number of minerals by which one or the other food is richer. The "coverage" charts below show how much of the daily needs can be covered by 300 grams of the food.
3
100 g
300 g
1 oz - 28.35g 1 package (8 oz) - 227g
Magnesium
Magnesium
Calcium
Calcium
Potassium
Potassium
Iron
Iron
Copper
Copper
Zinc
Zinc
Phosphorus
Phosphorus
Sodium
Sodium
Manganese
Manganese
Selenium
Selenium
50%
120%
124%
20%
27%
31%
190%
78%
5.2%
79%
6
100 g
300 g
0.5 tsp - 0.4g 1 tsp - 0.8g
Magnesium
Magnesium
Calcium
Calcium
Potassium
Potassium
Iron
Iron
Copper
Copper
Zinc
Zinc
Phosphorus
Phosphorus
Sodium
Sodium
Manganese
Manganese
Selenium
Selenium
114%
122%
54%
654%
185%
49%
45%
1.2%
224%
0%
Vitamin Comparison
Vitamin comparison score is based on the number of vitamins by which one or the other food is richer. The "coverage" charts below show how much of the daily needs can be covered by 300 grams of the food.
5
100 g
300 g
1 oz - 28.35g 1 package (8 oz) - 227g
Vitamin C
Vit. C
Vitamin D
Vit. D
Vitamin A
Vit. A
Vitamin E
Vit. E
Vitamin B1
Vit. B1
Vitamin B2
Vit. B2
Vitamin B3
Vit. B3
Vitamin B5
Vit. B5
Vitamin B6
Vit. B6
Vitamin B12
Vit. B12
Vitamin K
Vit. K
Folate
Folate
0%
0%
111%
0%
79%
319%
15%
201%
63%
303%
0%
3.8%
4
100 g
300 g
0.5 tsp - 0.4g 1 tsp - 0.8g
Vitamin C
Vit. C
Vitamin D
Vit. D
Vitamin A
Vit. A
Vitamin E
Vit. E
Vitamin B1
Vit. B1
Vitamin B2
Vit. B2
Vitamin B3
Vit. B3
Vitamin B5
Vit. B5
Vitamin B6
Vit. B6
Vitamin B12
Vit. B12
Vitamin K
Vit. K
Folate
Folate
534%
0%
79%
0%
12%
109%
34%
25%
80%
0%
0%
34%
All nutrients comparison - raw data values
Nutrient
DV% diff.
Iron
0.52mg
17.45mg
212%
Vitamin C
0mg
160.1mg
178%
Vitamin B12
2.42µg
0µg
101%
Saturated fat
19.16g
0.467g
85%
Manganese
0.04mg
1.719mg
73%
Vitamin B2
1.382mg
0.471mg
70%
Vitamin B5
3.351mg
0.409mg
59%
Fiber
0g
14g
56%
Copper
0.08mg
0.555mg
53%
Phosphorus
444mg
106mg
48%
Fats
29.51g
1.68g
43%
Cholesterol
94mg
0mg
31%
Sodium
600mg
9mg
26%
Selenium
14.5µg
26%
Potassium
1409mg
609mg
24%
Vitamin B1
0.315mg
0.048mg
22%
Magnesium
70mg
160mg
21%
Monounsaturated fat
7.879g
0.081g
19%
Calories
466kcal
101kcal
18%
Vitamin A
334µg
238µg
11%
Folate
5µg
45µg
10%
Protein
9.65g
5.56g
8%
Carbs
42.65g
24.45g
6%
Zinc
1.14mg
1.81mg
6%
Vitamin B3
0.813mg
1.824mg
6%
Vitamin B6
0.271mg
0.348mg
6%
Polyunsaturated fat
0.938g
0.532g
3%
Calcium
400mg
405mg
1%
Protein per 100 calories
2.1g
5.5g
N/A
Calories per 10 g protein
483kcal
182kcal
N/A
Weight per 100 calories
21g
99g
N/A
Unsaturated / Saturated Fat ratio
0.46
1.3
N/A
Net carbs
42.65g
10.45g
N/A
Tryptophan
0.135mg
0.114mg
0%
Threonine
0.393mg
0.154mg
0%
Isoleucine
0.519mg
0.285mg
0%
Leucine
0.992mg
0.262mg
0%
Lysine
0.814mg
0.126mg
0%
Methionine
0.318mg
0%
Phenylalanine
0.54mg
0%
Valine
0.765mg
0.307mg
0%
Histidine
0.293mg
0%
Macronutrient Comparison
Macronutrient breakdown side-by-side comparison
4
10%
30%
43%
13%
5%
Protein:
9.65 g
Fats:
29.51 g
Carbs:
42.65 g
Water:
13.44 g
Other:
4.75 g
1
6%
2%
24%
65%
3%
Protein:
5.56 g
Fats:
1.68 g
Carbs:
24.45 g
Water:
65.11 g
Other:
3.2 g
Contains
more
Protein Protein
+73.6%
Contains
more
Fats Fats
+1656.5%
Contains
more
Carbs Carbs
+74.4%
Contains
more
Other Other
+48.4%
Contains
more
Water Water
+384.4%
Fat Type Comparison
Fat type breakdown side-by-side comparison
2
68%
28%
3%
Saturated fat:
Sat. Fat
19.16 g
Monounsaturated fat:
Mono. Fat
7.879 g
Polyunsaturated fat:
Poly. Fat
0.938 g
1
43%
8%
49%
Saturated fat:
Sat. Fat
0.467 g
Monounsaturated fat:
Mono. Fat
0.081 g
Polyunsaturated fat:
Poly. Fat
0.532 g
Contains
more
Mono. Fat Monounsaturated fat
+9627.2%
Contains
more
Poly. Fat Polyunsaturated fat
+76.3%
Contains
less
Sat. Fat Saturated fat
-97.6%