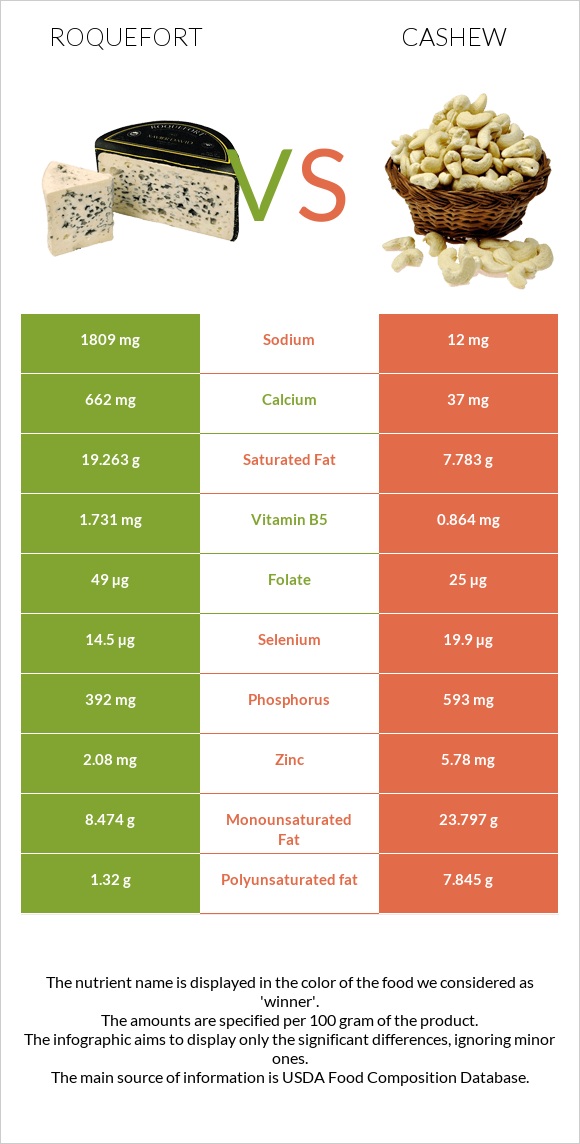
What are the main differences between roquefort and cashew? Roquefort is richer in calcium and vitamin B2, while cashew is higher in copper, iron, manganese, magnesium, zinc, and vitamin B1. Cashew's daily need coverage for copper is 240% higher. Cashew has 151 times less sodium than roquefort. Roquefort has 1809mg of sodium, while cashew has 12mg. We used Cheese, roquefort and Nuts, cashew nuts, raw types in this comparison.
Infographic
Mineral Comparison
Mineral comparison score is based on the number of minerals by which one or the other food is richer. The "coverage" charts below show how much of the daily needs can be covered by 300 grams of the food.
1
100 g
300 g
1 oz - 28.35g 1 package (3 oz) - 85g
Magnesium
Magnesium
Calcium
Calcium
Potassium
Potassium
Iron
Iron
Copper
Copper
Zinc
Zinc
Phosphorus
Phosphorus
Sodium
Sodium
Manganese
Manganese
Selenium
Selenium
21%
199%
8%
21%
11%
57%
168%
236%
3.9%
79%
9
100 g
300 g
1 oz - 28.35g
Magnesium
Magnesium
Calcium
Calcium
Potassium
Potassium
Iron
Iron
Copper
Copper
Zinc
Zinc
Phosphorus
Phosphorus
Sodium
Sodium
Manganese
Manganese
Selenium
Selenium
209%
11%
58%
251%
732%
158%
254%
1.6%
216%
109%
Vitamin Comparison
Vitamin comparison score is based on the number of vitamins by which one or the other food is richer. The "coverage" charts below show how much of the daily needs can be covered by 300 grams of the food.
5
100 g
300 g
1 oz - 28.35g 1 package (3 oz) - 85g
Vitamin C
Vit. C
Vitamin D
Vit. D
Vitamin A
Vit. A
Vitamin E
Vit. E
Vitamin B1
Vit. B1
Vitamin B2
Vit. B2
Vitamin B3
Vit. B3
Vitamin B5
Vit. B5
Vitamin B6
Vit. B6
Vitamin B12
Vit. B12
Vitamin K
Vit. K
Folate
Folate
0%
0%
98%
0%
10%
135%
14%
104%
29%
80%
0%
37%
6
100 g
300 g
1 oz - 28.35g
Vitamin C
Vit. C
Vitamin D
Vit. D
Vitamin A
Vit. A
Vitamin E
Vit. E
Vitamin B1
Vit. B1
Vitamin B2
Vit. B2
Vitamin B3
Vit. B3
Vitamin B5
Vit. B5
Vitamin B6
Vit. B6
Vitamin B12
Vit. B12
Vitamin K
Vit. K
Folate
Folate
1.7%
0%
0%
18%
106%
13%
20%
52%
96%
0%
85%
19%
All nutrients comparison - raw data values
Nutrient
DV% diff.
Copper
0.034mg
2.195mg
240%
Sodium
1809mg
12mg
78%
Iron
0.56mg
6.68mg
77%
Manganese
0.03mg
1.655mg
71%
Calcium
662mg
37mg
63%
Magnesium
30mg
292mg
62%
Saturated fat
19.263g
7.783g
52%
Polyunsaturated fat
1.32g
7.845g
44%
Vitamin B2
0.586mg
0.058mg
41%
Monounsaturated fat
8.474g
23.797g
38%
Zinc
2.08mg
5.78mg
34%
Vitamin A
294µg
0µg
33%
Vitamin B1
0.04mg
0.423mg
32%
Cholesterol
90mg
0mg
30%
Phosphorus
392mg
593mg
29%
Vitamin K
34.1µg
28%
Vitamin B12
0.64µg
0µg
27%
Vitamin B6
0.124mg
0.417mg
23%
Fats
30.64g
43.85g
20%
Potassium
91mg
660mg
17%
Vitamin B5
1.731mg
0.864mg
17%
Fiber
0g
3.3g
13%
Starch
23.49g
10%
Selenium
14.5µg
19.9µg
10%
Calories
369kcal
553kcal
9%
Carbs
2g
30.19g
9%
Protein
21.54g
18.22g
7%
Vitamin E
0.9mg
6%
Folate
49µg
25µg
6%
Vitamin B3
0.734mg
1.062mg
2%
Vitamin C
0mg
0.5mg
1%
Protein per 100 calories
5.8g
3.3g
N/A
Calories per 10 g protein
171kcal
304kcal
N/A
Weight per 100 calories
27g
18g
N/A
Unsaturated / Saturated Fat ratio
0.51
4.1
N/A
Net carbs
2g
26.89g
N/A
Sugar
5.91g
N/A
Tryptophan
0.303mg
0.287mg
0%
Threonine
0.965mg
0.688mg
0%
Isoleucine
1.217mg
0.789mg
0%
Leucine
2.114mg
1.472mg
0%
Lysine
1.848mg
0.928mg
0%
Methionine
0.558mg
0.362mg
0%
Phenylalanine
1.023mg
0.951mg
0%
Valine
1.614mg
1.094mg
0%
Histidine
0.602mg
0.456mg
0%
Fructose
0.05g
0%
Macronutrient Comparison
Macronutrient breakdown side-by-side comparison
3
22%
31%
2%
39%
6%
Protein:
21.54 g
Fats:
30.64 g
Carbs:
2 g
Water:
39.38 g
Other:
6.44 g
2
18%
44%
30%
5%
3%
Protein:
18.22 g
Fats:
43.85 g
Carbs:
30.19 g
Water:
5.2 g
Other:
2.54 g
Contains
more
Protein Protein
+18.2%
Contains
more
Water Water
+657.3%
Contains
more
Other Other
+153.5%
Contains
more
Fats Fats
+43.1%
Contains
more
Carbs Carbs
+1409.5%
Fat Type Comparison
Fat type breakdown side-by-side comparison
0
66%
29%
5%
Saturated fat:
Sat. Fat
19.263 g
Monounsaturated fat:
Mono. Fat
8.474 g
Polyunsaturated fat:
Poly. Fat
1.32 g
3
20%
60%
20%
Saturated fat:
Sat. Fat
7.783 g
Monounsaturated fat:
Mono. Fat
23.797 g
Polyunsaturated fat:
Poly. Fat
7.845 g
Contains
less
Sat. Fat Saturated fat
-59.6%
Contains
more
Mono. Fat Monounsaturated fat
+180.8%
Contains
more
Poly. Fat Polyunsaturated fat
+494.3%