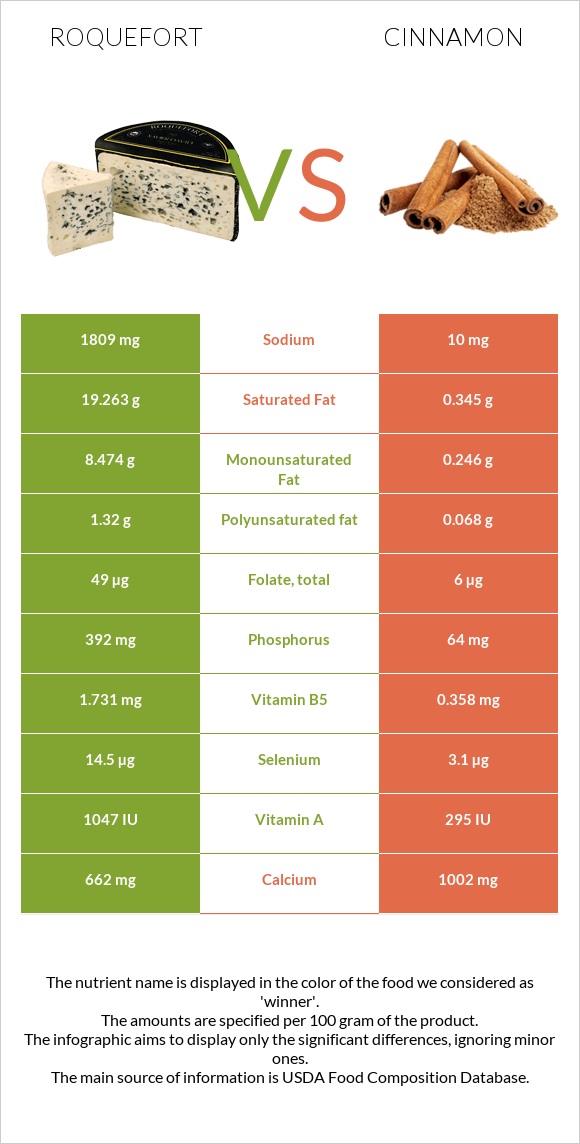
How are roquefort and cinnamon different? Roquefort is higher in phosphorus and vitamin B2; however, cinnamon is richer in manganese, fiber, iron, calcium, and copper. Daily need coverage for manganese for cinnamon is 758% higher. Cheese, roquefort and Spices, cinnamon, ground are the varieties used in this article.
Infographic
Mineral Comparison
Mineral comparison score is based on the number of minerals by which one or the other food is richer. The "coverage" charts below show how much of the daily needs can be covered by 300 grams of the food.
3
100 g
300 g
1 oz - 28.35g 1 package (3 oz) - 85g
Magnesium
Magnesium
Calcium
Calcium
Potassium
Potassium
Iron
Iron
Copper
Copper
Zinc
Zinc
Phosphorus
Phosphorus
Sodium
Sodium
Manganese
Manganese
Selenium
Selenium
21%
199%
8%
21%
11%
57%
168%
236%
3.9%
79%
7
100 g
300 g
0.25 tsp - 0.5g 1 tbsp - 7.8g
Magnesium
Magnesium
Calcium
Calcium
Potassium
Potassium
Iron
Iron
Copper
Copper
Zinc
Zinc
Phosphorus
Phosphorus
Sodium
Sodium
Manganese
Manganese
Selenium
Selenium
43%
301%
38%
312%
113%
50%
27%
1.3%
2278%
17%
Vitamin Comparison
Vitamin comparison score is based on the number of vitamins by which one or the other food is richer. The "coverage" charts below show how much of the daily needs can be covered by 300 grams of the food.
6
100 g
300 g
1 oz - 28.35g 1 package (3 oz) - 85g
Vitamin C
Vit. C
Vitamin D
Vit. D
Vitamin A
Vit. A
Vitamin E
Vit. E
Vitamin B1
Vit. B1
Vitamin B2
Vit. B2
Vitamin B3
Vit. B3
Vitamin B5
Vit. B5
Vitamin B6
Vit. B6
Vitamin B12
Vit. B12
Vitamin K
Vit. K
Folate
Folate
0%
0%
98%
0%
10%
135%
14%
104%
29%
80%
0%
37%
5
100 g
300 g
0.25 tsp - 0.5g 1 tbsp - 7.8g
Vitamin C
Vit. C
Vitamin D
Vit. D
Vitamin A
Vit. A
Vitamin E
Vit. E
Vitamin B1
Vit. B1
Vitamin B2
Vit. B2
Vitamin B3
Vit. B3
Vitamin B5
Vit. B5
Vitamin B6
Vit. B6
Vitamin B12
Vit. B12
Vitamin K
Vit. K
Folate
Folate
13%
0%
5%
46%
5.5%
9.5%
25%
21%
36%
0%
78%
4.5%
All nutrients comparison - raw data values
Nutrient
DV% diff.
Manganese
0.03mg
17.466mg
758%
Fiber
0g
53.1g
212%
Iron
0.56mg
8.32mg
97%
Saturated fat
19.263g
0.345g
86%
Sodium
1809mg
10mg
78%
Phosphorus
392mg
64mg
47%
Fats
30.64g
1.24g
45%
Vitamin B2
0.586mg
0.041mg
42%
Protein
21.54g
3.99g
35%
Calcium
662mg
1002mg
34%
Copper
0.034mg
0.339mg
34%
Vitamin A
294µg
15µg
31%
Cholesterol
90mg
0mg
30%
Vitamin B5
1.731mg
0.358mg
27%
Vitamin B12
0.64µg
0µg
27%
Carbs
2g
80.59g
26%
Vitamin K
31.2µg
26%
Selenium
14.5µg
3.1µg
21%
Monounsaturated fat
8.474g
0.246g
21%
Vitamin E
2.32mg
15%
Folate
49µg
6µg
11%
Potassium
91mg
431mg
10%
Polyunsaturated fat
1.32g
0.068g
8%
Magnesium
30mg
60mg
7%
Calories
369kcal
247kcal
6%
Vitamin C
0mg
3.8mg
4%
Vitamin B3
0.734mg
1.332mg
4%
Vitamin B6
0.124mg
0.158mg
3%
Zinc
2.08mg
1.83mg
2%
Vitamin B1
0.04mg
0.022mg
2%
Choline
11mg
2%
Fructose
1.11g
1%
Protein per 100 calories
5.8g
1.6g
N/A
Calories per 10 g protein
171kcal
619kcal
N/A
Weight per 100 calories
27g
40g
N/A
Unsaturated / Saturated Fat ratio
0.51
0.91
N/A
Net carbs
2g
27.49g
N/A
Sugar
2.17g
N/A
Tryptophan
0.303mg
0.049mg
0%
Threonine
0.965mg
0.136mg
0%
Isoleucine
1.217mg
0.146mg
0%
Leucine
2.114mg
0.253mg
0%
Lysine
1.848mg
0.243mg
0%
Methionine
0.558mg
0.078mg
0%
Phenylalanine
1.023mg
0.146mg
0%
Valine
1.614mg
0.224mg
0%
Histidine
0.602mg
0.117mg
0%
Omega-3 - ALA
0.011g
N/A
Macronutrient Comparison
Macronutrient breakdown side-by-side comparison
4
22%
31%
2%
39%
6%
Protein:
21.54 g
Fats:
30.64 g
Carbs:
2 g
Water:
39.38 g
Other:
6.44 g
1
4%
81%
11%
4%
Protein:
3.99 g
Fats:
1.24 g
Carbs:
80.59 g
Water:
10.58 g
Other:
3.6 g
Contains
more
Protein Protein
+439.8%
Contains
more
Fats Fats
+2371%
Contains
more
Water Water
+272.2%
Contains
more
Other Other
+78.9%
Contains
more
Carbs Carbs
+3929.5%
Fat Type Comparison
Fat type breakdown side-by-side comparison
2
66%
29%
5%
Saturated fat:
Sat. Fat
19.263 g
Monounsaturated fat:
Mono. Fat
8.474 g
Polyunsaturated fat:
Poly. Fat
1.32 g
1
52%
37%
10%
Saturated fat:
Sat. Fat
0.345 g
Monounsaturated fat:
Mono. Fat
0.246 g
Polyunsaturated fat:
Poly. Fat
0.068 g
Contains
more
Mono. Fat Monounsaturated fat
+3344.7%
Contains
more
Poly. Fat Polyunsaturated fat
+1841.2%
Contains
less
Sat. Fat Saturated fat
-98.2%