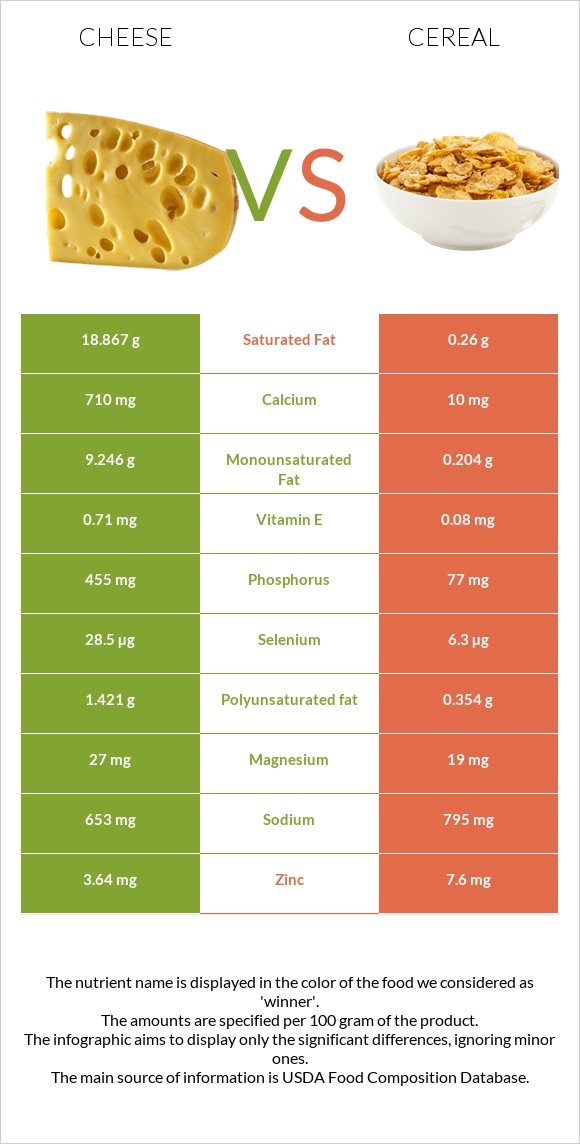
What are the differences between cheese and cereal? Cheese is higher in calcium, phosphorus, and selenium; however, cereal is richer in vitamin B1, vitamin B6, iron, vitamin B2, vitamin B3, and vitamin C. Cereal's daily need coverage for vitamin B1 is 522% more. Cereal contains 73 times less saturated fat than cheese. Cheese contains 18.867g of saturated fat, while cereal contains 0.26g. Cheese has a lower glycemic index (0) than cereal (69). We used Cheese, cheddar and Cereals ready-to-eat, USDA Commodity Corn and Rice (includes all commodity brands) types in this article.
Infographic
Mineral Comparison
Mineral comparison score is based on the number of minerals by which one or the other food is richer. The "coverage" charts below show how much of the daily needs can be covered by 300 grams of the food.
5
100 g
300 g
1 cubic inch - 17g 1 slice (1 oz) - 28g 1 oz - 28.35g 1 cup, shredded - 113g 1 cup, diced - 132g 1 cup, melted - 244g
Magnesium
Magnesium
Calcium
Calcium
Potassium
Potassium
Iron
Iron
Copper
Copper
Zinc
Zinc
Phosphorus
Phosphorus
Sodium
Sodium
Manganese
Manganese
Selenium
Selenium
19%
213%
6.7%
5.3%
10%
99%
195%
85%
3.5%
155%
5
100 g
300 g
1 cup - 29g 1 serving (NLEA serving = 1 cup) - 29g
Magnesium
Magnesium
Calcium
Calcium
Potassium
Potassium
Iron
Iron
Copper
Copper
Zinc
Zinc
Phosphorus
Phosphorus
Sodium
Sodium
Manganese
Manganese
Selenium
Selenium
14%
3%
9.3%
1277%
46%
207%
33%
104%
103%
34%
Vitamin Comparison
Vitamin comparison score is based on the number of vitamins by which one or the other food is richer. The "coverage" charts below show how much of the daily needs can be covered by 300 grams of the food.
6
100 g
300 g
1 cubic inch - 17g 1 slice (1 oz) - 28g 1 oz - 28.35g 1 cup, shredded - 113g 1 cup, diced - 132g 1 cup, melted - 244g
Vitamin C
Vit. C
Vitamin D
Vit. D
Vitamin A
Vit. A
Vitamin E
Vit. E
Vitamin B1
Vit. B1
Vitamin B2
Vit. B2
Vitamin B3
Vit. B3
Vitamin B5
Vit. B5
Vitamin B6
Vit. B6
Vitamin B12
Vit. B12
Vitamin K
Vit. K
Folate
Folate
0%
9%
110%
14%
7.3%
99%
1.1%
25%
15%
138%
6%
20%
6
100 g
300 g
1 cup - 29g 1 serving (NLEA serving = 1 cup) - 29g
Vitamin C
Vit. C
Vitamin D
Vit. D
Vitamin A
Vit. A
Vitamin E
Vit. E
Vitamin B1
Vit. B1
Vitamin B2
Vit. B2
Vitamin B3
Vit. B3
Vitamin B5
Vit. B5
Vitamin B6
Vit. B6
Vitamin B12
Vit. B12
Vitamin K
Vit. K
Folate
Folate
128%
0%
271%
1.6%
1572%
893%
555%
14%
1381%
0%
0%
0%
All nutrients comparison - raw data values
Nutrient
DV% diff.
Vitamin B1
0.029mg
6.288mg
522%
Vitamin B6
0.066mg
5.986mg
455%
Iron
0.14mg
34.06mg
424%
Vitamin B2
0.428mg
3.87mg
265%
Vitamin B3
0.059mg
29.62mg
185%
Saturated fat
18.867g
0.26g
85%
Calcium
710mg
10mg
70%
Phosphorus
455mg
77mg
54%
Vitamin A
330µg
814µg
54%
Fats
33.31g
1.08g
50%
Vitamin B12
1.1µg
46%
Vitamin C
0mg
38.5mg
43%
Selenium
28.5µg
6.3µg
40%
Zinc
3.64mg
7.6mg
36%
Protein
22.87g
6.06g
34%
Cholesterol
99mg
33%
Manganese
0.027mg
0.79mg
33%
Carbs
3.09g
86.85g
28%
Monounsaturated fat
9.246g
0.204g
23%
Copper
0.03mg
0.137mg
12%
Folate
27µg
7%
Polyunsaturated fat
1.421g
0.354g
7%
Fiber
0g
1.4g
6%
Sodium
653mg
795mg
6%
Vitamin E
0.71mg
0.08mg
4%
Vitamin B5
0.41mg
0.226mg
4%
Vitamin D*
24 IU
3%
Vitamin D
0.6µg
3%
Choline
16.5mg
3%
Magnesium
27mg
19mg
2%
Vitamin K
2.4µg
0µg
2%
Calories
404kcal
378kcal
1%
Potassium
76mg
105mg
1%
Protein per 100 calories
5.7g
1.6g
N/A
Calories per 10 g protein
177kcal
624kcal
N/A
Weight per 100 calories
25g
26g
N/A
Unsaturated / Saturated Fat ratio
0.57
2.1
N/A
Net carbs
3.09g
85.45g
N/A
Sugar
0.48g
10.35g
N/A
Trans fat
0.917g
N/A
Tryptophan
0.547mg
0.066mg
0%
Threonine
1.044mg
0.241mg
0%
Isoleucine
1.206mg
0.26mg
0%
Leucine
1.939mg
0.767mg
0%
Lysine
1.025mg
0.113mg
0%
Methionine
0.547mg
0.13mg
0%
Phenylalanine
1.074mg
0.365mg
0%
Valine
1.404mg
0.344mg
0%
Histidine
0.547mg
0.162mg
0%
Fructose
0g
0.26g
0%
Omega-3 - EPA
0.01g
0g
N/A
Omega-3 - DHA
0.001g
0g
N/A
Omega-3 - DPA
0.017g
0g
N/A
Omega-6 - Eicosadienoic acid
0.007g
0g
N/A
Macronutrient Comparison
Macronutrient breakdown side-by-side comparison
4
23%
33%
3%
37%
4%
Protein:
22.87 g
Fats:
33.31 g
Carbs:
3.09 g
Water:
37.02 g
Other:
3.71 g
1
6%
87%
4%
2%
Protein:
6.06 g
Fats:
1.08 g
Carbs:
86.85 g
Water:
3.78 g
Other:
2.23 g
Contains
more
Protein Protein
+277.4%
Contains
more
Fats Fats
+2984.3%
Contains
more
Water Water
+879.4%
Contains
more
Other Other
+66.4%
Contains
more
Carbs Carbs
+2710.7%
Fat Type Comparison
Fat type breakdown side-by-side comparison
2
64%
31%
5%
Saturated fat:
Sat. Fat
18.867 g
Monounsaturated fat:
Mono. Fat
9.246 g
Polyunsaturated fat:
Poly. Fat
1.421 g
1
32%
25%
43%
Saturated fat:
Sat. Fat
0.26 g
Monounsaturated fat:
Mono. Fat
0.204 g
Polyunsaturated fat:
Poly. Fat
0.354 g
Contains
more
Mono. Fat Monounsaturated fat
+4432.4%
Contains
more
Poly. Fat Polyunsaturated fat
+301.4%
Contains
less
Sat. Fat Saturated fat
-98.6%
Carbohydrate type comparison
Carbohydrate type breakdown side-by-side comparison
2
54%
25%
21%
Starch:
0 g
Sucrose:
0 g
Glucose:
0.26 g
Fructose:
0 g
Lactose:
0.12 g
Maltose:
0 g
Galactose:
0.1 g
4
94%
3%
3%
Starch:
0 g
Sucrose:
9.74 g
Glucose:
0.27 g
Fructose:
0.26 g
Lactose:
0 g
Maltose:
0.09 g
Galactose:
0 g
Contains
more
Lactose Lactose
+∞%
Contains
more
Galactose Galactose
+∞%
Contains
more
Sucrose Sucrose
+∞%
Contains
more
Fructose Fructose
+∞%
Contains
more
Maltose Maltose
+∞%
~equal in
Starch
~0g
~equal in
Glucose
~0.27g