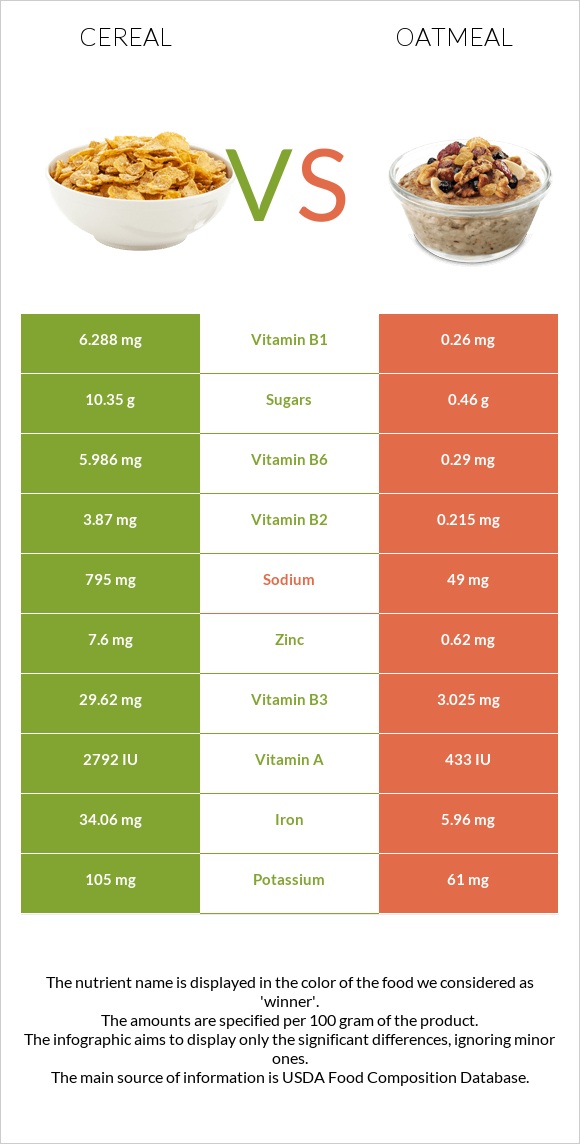
Differences between cereal and oatmeal Oatmeal contains less vitamin B1, vitamin B6, iron, vitamin B2, vitamin B3, zinc, vitamin A, vitamin C, and manganese than cereal. Cereal's daily need coverage for vitamin B1 is 502% higher. The amount of sodium in oatmeal is lower. The food types used in this comparison are Cereals ready-to-eat, USDA Commodity Corn and Rice (includes all commodity brands) and Cereals, oats, instant, fortified, plain, prepared with water (boiling water added or microwaved) .
Infographic
Mineral Comparison
Mineral comparison score is based on the number of minerals by which one or the other food is richer. The "coverage" charts below show how much of the daily needs can be covered by 300 grams of the food.
6
100 g
300 g
1 cup - 29g 1 serving (NLEA serving = 1 cup) - 29g
Magnesium
Magnesium
Calcium
Calcium
Potassium
Potassium
Iron
Iron
Copper
Copper
Zinc
Zinc
Phosphorus
Phosphorus
Sodium
Sodium
Manganese
Manganese
Selenium
Selenium
14%
3%
9.3%
1277%
46%
207%
33%
104%
103%
34%
3
100 g
300 g
1 oz, dry, yields - 177g 1 packet, dry, yields - 177g 1 cup, cooked - 234g 1 cup, dry, yields - 501g
Magnesium
Magnesium
Calcium
Calcium
Potassium
Potassium
Iron
Iron
Copper
Copper
Zinc
Zinc
Phosphorus
Phosphorus
Sodium
Sodium
Manganese
Manganese
Selenium
Selenium
19%
24%
5.4%
224%
22%
17%
33%
6.4%
73%
27%
Vitamin Comparison
Vitamin comparison score is based on the number of vitamins by which one or the other food is richer. The "coverage" charts below show how much of the daily needs can be covered by 300 grams of the food.
7
100 g
300 g
1 cup - 29g 1 serving (NLEA serving = 1 cup) - 29g
Vitamin C
Vit. C
Vitamin D
Vit. D
Vitamin A
Vit. A
Vitamin E
Vit. E
Vitamin B1
Vit. B1
Vitamin B2
Vit. B2
Vitamin B3
Vit. B3
Vitamin B5
Vit. B5
Vitamin B6
Vit. B6
Vitamin B12
Vit. B12
Vitamin K
Vit. K
Folate
Folate
128%
0%
271%
1.6%
1572%
893%
555%
14%
1381%
0%
0%
0%
3
100 g
300 g
1 oz, dry, yields - 177g 1 packet, dry, yields - 177g 1 cup, cooked - 234g 1 cup, dry, yields - 501g
Vitamin C
Vit. C
Vitamin D
Vit. D
Vitamin A
Vit. A
Vitamin E
Vit. E
Vitamin B1
Vit. B1
Vitamin B2
Vit. B2
Vitamin B3
Vit. B3
Vitamin B5
Vit. B5
Vitamin B6
Vit. B6
Vitamin B12
Vit. B12
Vitamin K
Vit. K
Folate
Folate
0%
0%
43%
1.4%
65%
50%
57%
19%
67%
0%
1%
33%
All nutrients comparison - raw data values
Nutrient
DV% diff.
Vitamin B1
6.288mg
0.26mg
502%
Vitamin B6
5.986mg
0.29mg
438%
Iron
34.06mg
5.96mg
351%
Vitamin B2
3.87mg
0.215mg
281%
Vitamin B3
29.62mg
3.025mg
166%
Vitamin A
814µg
130µg
76%
Zinc
7.6mg
0.62mg
63%
Vitamin C
38.5mg
0mg
43%
Sodium
795mg
49mg
32%
Carbs
86.85g
11.67g
25%
Calories
378kcal
68kcal
16%
Folate
44µg
11%
Manganese
0.79mg
0.558mg
10%
Copper
0.137mg
0.066mg
8%
Protein
6.06g
2.37g
7%
Calcium
10mg
80mg
7%
Starch
10.37g
4%
Magnesium
19mg
26mg
2%
Selenium
6.3µg
5µg
2%
Vitamin B5
0.226mg
0.317mg
2%
Potassium
105mg
61mg
1%
Fiber
1.4g
1.7g
1%
Choline
4.7mg
1%
Protein per 100 calories
1.6g
3.5g
N/A
Calories per 10 g protein
624kcal
287kcal
N/A
Weight per 100 calories
26g
147g
N/A
Fats
1.08g
1.36g
0%
Net carbs
85.45g
9.97g
N/A
Sugar
10.35g
0.46g
N/A
Phosphorus
77mg
77mg
0%
Vitamin E
0.08mg
0.07mg
0%
Vitamin K
0µg
0.4µg
0%
Trans fat
0.003g
N/A
Saturated fat
0.26g
0.226g
0%
Monounsaturated fat
0.204g
0.391g
0%
Polyunsaturated fat
0.354g
0.426g
0%
Tryptophan
0.066mg
0.04mg
0%
Threonine
0.241mg
0.083mg
0%
Isoleucine
0.26mg
0.105mg
0%
Leucine
0.767mg
0.2mg
0%
Lysine
0.113mg
0.135mg
0%
Methionine
0.13mg
0.04mg
0%
Phenylalanine
0.365mg
0.13mg
0%
Valine
0.344mg
0.151mg
0%
Histidine
0.162mg
0.057mg
0%
Fructose
0.26g
0g
0%
Macronutrient Comparison
Macronutrient breakdown side-by-side comparison
3
6%
87%
4%
2%
Protein:
6.06 g
Fats:
1.08 g
Carbs:
86.85 g
Water:
3.78 g
Other:
2.23 g
2
2%
12%
84%
Protein:
2.37 g
Fats:
1.36 g
Carbs:
11.67 g
Water:
84.03 g
Other:
0.57 g
Contains
more
Protein Protein
+155.7%
Contains
more
Carbs Carbs
+644.2%
Contains
more
Other Other
+291.2%
Contains
more
Fats Fats
+25.9%
Contains
more
Water Water
+2123%
Fat Type Comparison
Fat type breakdown side-by-side comparison
0
32%
25%
43%
Saturated fat:
Sat. Fat
0.26 g
Monounsaturated fat:
Mono. Fat
0.204 g
Polyunsaturated fat:
Poly. Fat
0.354 g
3
22%
37%
41%
Saturated fat:
Sat. Fat
0.226 g
Monounsaturated fat:
Mono. Fat
0.391 g
Polyunsaturated fat:
Poly. Fat
0.426 g
Contains
less
Sat. Fat Saturated fat
-13.1%
Contains
more
Mono. Fat Monounsaturated fat
+91.7%
Contains
more
Poly. Fat Polyunsaturated fat
+20.3%
Carbohydrate type comparison
Carbohydrate type breakdown side-by-side comparison
4
94%
3%
3%
Starch:
0 g
Sucrose:
9.74 g
Glucose:
0.27 g
Fructose:
0.26 g
Lactose:
0 g
Maltose:
0.09 g
Galactose:
0 g
2
96%
3%
Starch:
10.37 g
Sucrose:
0.29 g
Glucose:
0 g
Fructose:
0 g
Lactose:
0 g
Maltose:
0 g
Galactose:
0.16 g
Contains
more
Sucrose Sucrose
+3258.6%
Contains
more
Glucose Glucose
+∞%
Contains
more
Fructose Fructose
+∞%
Contains
more
Maltose Maltose
+∞%
Contains
more
Starch Starch
+∞%
Contains
more
Galactose Galactose
+∞%