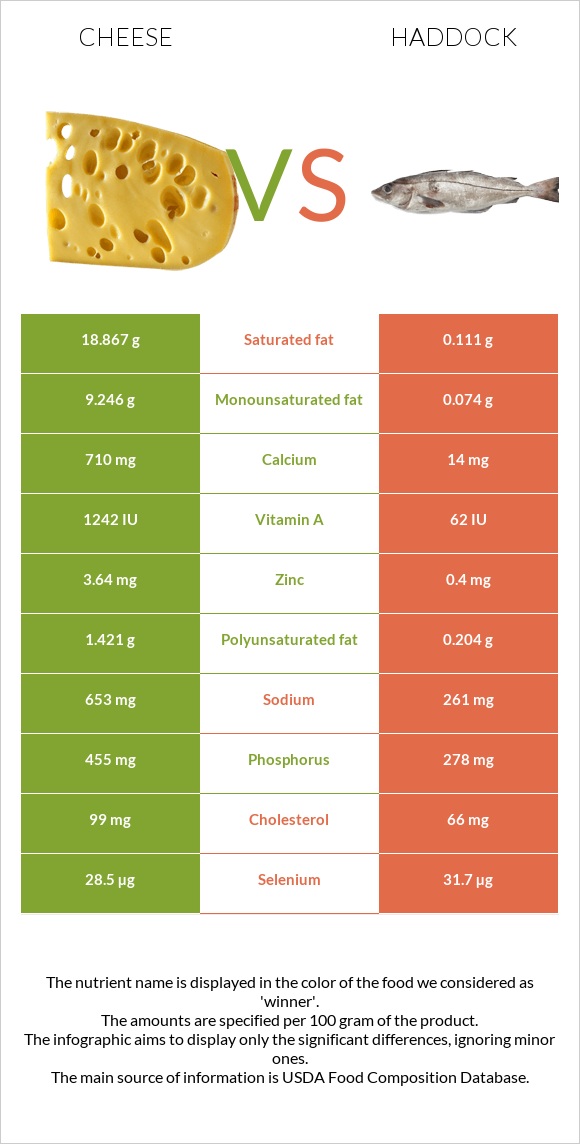
Summary of differences between cheese and haddock Cheese has more calcium, zinc, vitamin B2, phosphorus, and vitamin A; however, haddock is higher in vitamin B12, vitamin B3, and vitamin B6. Cheese covers your daily need for saturated fat, 94% more than haddock. Cheese has 51 times more calcium than haddock. While cheese has 710mg of calcium, haddock has only 14mg. Haddock has less saturated fat. These are the specific foods used in this comparison Cheese, cheddar and Fish, haddock, cooked, dry heat .
Infographic
Mineral Comparison
Mineral comparison score is based on the number of minerals by which one or the other food is richer. The "coverage" charts below show how much of the daily needs can be covered by 300 grams of the food.
5
100 g
300 g
1 cubic inch - 17g 1 slice (1 oz) - 28g 1 oz - 28.35g 1 cup, shredded - 113g 1 cup, diced - 132g 1 cup, melted - 244g
Magnesium
Magnesium
Calcium
Calcium
Potassium
Potassium
Iron
Iron
Copper
Copper
Zinc
Zinc
Phosphorus
Phosphorus
Sodium
Sodium
Manganese
Manganese
Selenium
Selenium
19%
213%
6.7%
5.3%
10%
99%
195%
85%
3.5%
155%
4
100 g
300 g
3 oz - 85g 1 fillet - 150g
Magnesium
Magnesium
Calcium
Calcium
Potassium
Potassium
Iron
Iron
Copper
Copper
Zinc
Zinc
Phosphorus
Phosphorus
Sodium
Sodium
Manganese
Manganese
Selenium
Selenium
19%
4.2%
31%
7.9%
8.7%
11%
119%
34%
1.7%
173%
Vitamin Comparison
Vitamin comparison score is based on the number of vitamins by which one or the other food is richer. The "coverage" charts below show how much of the daily needs can be covered by 300 grams of the food.
6
100 g
300 g
1 cubic inch - 17g 1 slice (1 oz) - 28g 1 oz - 28.35g 1 cup, shredded - 113g 1 cup, diced - 132g 1 cup, melted - 244g
Vitamin C
Vit. C
Vitamin D
Vit. D
Vitamin A
Vit. A
Vitamin E
Vit. E
Vitamin B1
Vit. B1
Vitamin B2
Vit. B2
Vitamin B3
Vit. B3
Vitamin B5
Vit. B5
Vitamin B6
Vit. B6
Vitamin B12
Vit. B12
Vitamin K
Vit. K
Folate
Folate
0%
9%
110%
14%
7.3%
99%
1.1%
25%
15%
138%
6%
20%
4
100 g
300 g
3 oz - 85g 1 fillet - 150g
Vitamin C
Vit. C
Vitamin D
Vit. D
Vitamin A
Vit. A
Vitamin E
Vit. E
Vitamin B1
Vit. B1
Vitamin B2
Vit. B2
Vitamin B3
Vit. B3
Vitamin B5
Vit. B5
Vitamin B6
Vit. B6
Vitamin B12
Vit. B12
Vitamin K
Vit. K
Folate
Folate
0%
9%
7%
11%
5.8%
16%
77%
30%
75%
266%
0.25%
9.8%
All nutrients comparison - raw data values
Nutrient
DV% diff.
Saturated fat
18.867g
0.111g
85%
Calcium
710mg
14mg
70%
Fats
33.31g
0.55g
50%
Vitamin B12
1.1µg
2.13µg
43%
Vitamin A
330µg
21µg
34%
Zinc
3.64mg
0.4mg
29%
Vitamin B2
0.428mg
0.069mg
28%
Phosphorus
455mg
278mg
25%
Vitamin B3
0.059mg
4.119mg
25%
Monounsaturated fat
9.246g
0.074g
23%
Vitamin B6
0.066mg
0.327mg
20%
Sodium
653mg
261mg
17%
Calories
404kcal
90kcal
16%
Cholesterol
99mg
66mg
11%
Choline
16.5mg
79.6mg
11%
Potassium
76mg
351mg
8%
Polyunsaturated fat
1.421g
0.204g
8%
Protein
22.87g
19.99g
6%
Selenium
28.5µg
31.7µg
6%
Folate
27µg
13µg
4%
Vitamin B5
0.41mg
0.494mg
2%
Vitamin K
2.4µg
0.1µg
2%
Carbs
3.09g
0g
1%
Iron
0.14mg
0.21mg
1%
Vitamin E
0.71mg
0.55mg
1%
Manganese
0.027mg
0.013mg
1%
Vitamin B1
0.029mg
0.023mg
1%
Protein per 100 calories
5.7g
22g
N/A
Calories per 10 g protein
177kcal
45kcal
N/A
Weight per 100 calories
25g
111g
N/A
Unsaturated / Saturated Fat ratio
0.57
2.5
N/A
Net carbs
3.09g
0g
N/A
Vitamin D*
24 IU
23 IU
0%
Vitamin D
0.6µg
0.6µg
0%
Magnesium
27mg
26mg
0%
Sugar
0.48g
0g
N/A
Copper
0.03mg
0.026mg
0%
Trans fat
0.917g
0.005g
N/A
Tryptophan
0.547mg
0.26mg
0%
Threonine
1.044mg
1.015mg
0%
Isoleucine
1.206mg
1.067mg
0%
Leucine
1.939mg
1.882mg
0%
Lysine
1.025mg
2.126mg
0%
Methionine
0.547mg
0.686mg
0%
Phenylalanine
1.074mg
0.904mg
0%
Valine
1.404mg
1.193mg
0%
Histidine
0.547mg
0.682mg
0%
Omega-3 - EPA
0.01g
0.051g
N/A
Omega-3 - DHA
0.001g
0.109g
N/A
Omega-3 - DPA
0.017g
0.006g
N/A
Omega-6 - Eicosadienoic acid
0.007g
0.001g
N/A
Macronutrient Comparison
Macronutrient breakdown side-by-side comparison
4
23%
33%
3%
37%
4%
Protein:
22.87 g
Fats:
33.31 g
Carbs:
3.09 g
Water:
37.02 g
Other:
3.71 g
1
20%
79%
Protein:
19.99 g
Fats:
0.55 g
Carbs:
0 g
Water:
79.65 g
Other:
0 g
Contains
more
Protein Protein
+14.4%
Contains
more
Fats Fats
+5956.4%
Contains
more
Carbs Carbs
+∞%
Contains
more
Other Other
+∞%
Contains
more
Water Water
+115.2%
Fat Type Comparison
Fat type breakdown side-by-side comparison
2
64%
31%
5%
Saturated fat:
Sat. Fat
18.867 g
Monounsaturated fat:
Mono. Fat
9.246 g
Polyunsaturated fat:
Poly. Fat
1.421 g
1
29%
19%
52%
Saturated fat:
Sat. Fat
0.111 g
Monounsaturated fat:
Mono. Fat
0.074 g
Polyunsaturated fat:
Poly. Fat
0.204 g
Contains
more
Mono. Fat Monounsaturated fat
+12394.6%
Contains
more
Poly. Fat Polyunsaturated fat
+596.6%
Contains
less
Sat. Fat Saturated fat
-99.4%