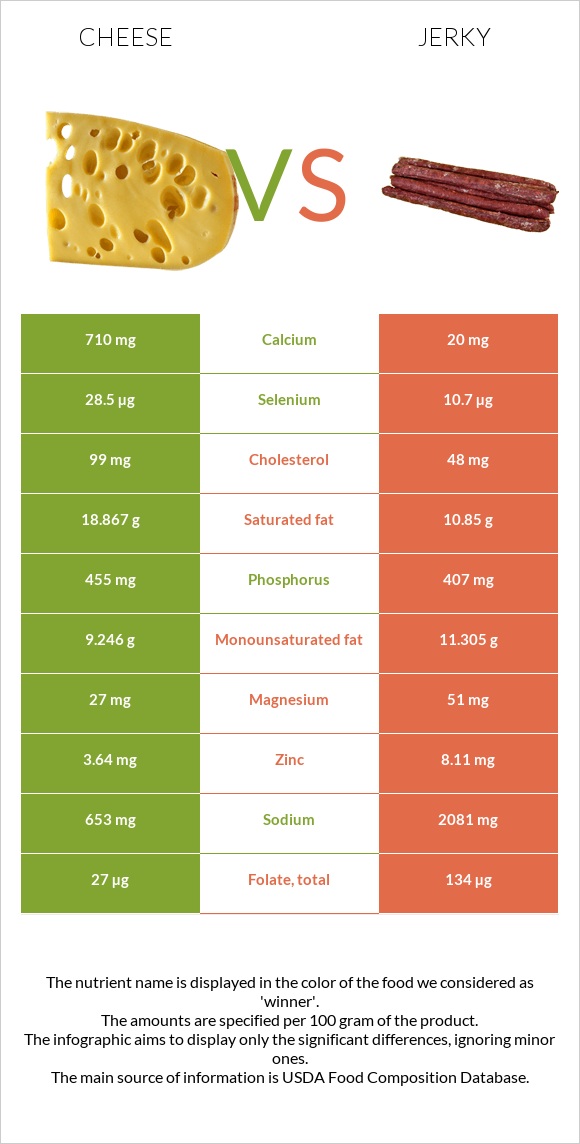
Differences between cheese and jerky Cheese has more calcium, selenium, vitamin A, and vitamin B2, while jerky has more iron, zinc, folate, and copper. Cheese's daily need coverage for calcium is 69% higher. The amount of saturated fat in jerky is lower. The food types used in this comparison are Cheese, cheddar and Snacks, beef jerky, chopped, and formed .
Infographic
Mineral Comparison
Mineral comparison score is based on the number of minerals by which one or the other food is richer. The "coverage" charts below show how much of the daily needs can be covered by 300 grams of the food.
4
100 g
300 g
1 cubic inch - 17g 1 slice (1 oz) - 28g 1 oz - 28.35g 1 cup, shredded - 113g 1 cup, diced - 132g 1 cup, melted - 244g
Magnesium
Magnesium
Calcium
Calcium
Potassium
Potassium
Iron
Iron
Copper
Copper
Zinc
Zinc
Phosphorus
Phosphorus
Sodium
Sodium
Manganese
Manganese
Selenium
Selenium
19%
213%
6.7%
5.3%
10%
99%
195%
85%
3.5%
155%
6
100 g
300 g
1 piece, large - 20g 1 oz - 28.35g 1 oz - 28.35g
Magnesium
Magnesium
Calcium
Calcium
Potassium
Potassium
Iron
Iron
Copper
Copper
Zinc
Zinc
Phosphorus
Phosphorus
Sodium
Sodium
Manganese
Manganese
Selenium
Selenium
36%
6%
53%
203%
76%
221%
174%
271%
14%
58%
Vitamin Comparison
Vitamin comparison score is based on the number of vitamins by which one or the other food is richer. The "coverage" charts below show how much of the daily needs can be covered by 300 grams of the food.
5
100 g
300 g
1 cubic inch - 17g 1 slice (1 oz) - 28g 1 oz - 28.35g 1 cup, shredded - 113g 1 cup, diced - 132g 1 cup, melted - 244g
Vitamin C
Vit. C
Vitamin D
Vit. D
Vitamin A
Vit. A
Vitamin E
Vit. E
Vitamin B1
Vit. B1
Vitamin B2
Vit. B2
Vitamin B3
Vit. B3
Vitamin B5
Vit. B5
Vitamin B6
Vit. B6
Vitamin B12
Vit. B12
Vitamin K
Vit. K
Folate
Folate
0%
9%
110%
14%
7.3%
99%
1.1%
25%
15%
138%
6%
20%
4
100 g
300 g
1 piece, large - 20g 1 oz - 28.35g 1 oz - 28.35g
Vitamin C
Vit. C
Vitamin D
Vit. D
Vitamin A
Vit. A
Vitamin E
Vit. E
Vitamin B1
Vit. B1
Vitamin B2
Vit. B2
Vitamin B3
Vit. B3
Vitamin B5
Vit. B5
Vitamin B6
Vit. B6
Vitamin B12
Vit. B12
Vitamin K
Vit. K
Folate
Folate
0%
4.5%
0%
9.8%
39%
33%
32%
9.8%
41%
124%
5.8%
101%
All nutrients comparison - raw data values
Nutrient
DV% diff.
Calcium
710mg
20mg
69%
Iron
0.14mg
5.42mg
66%
Sodium
653mg
2081mg
62%
Zinc
3.64mg
8.11mg
41%
Vitamin A
330µg
0µg
37%
Saturated fat
18.867g
10.85g
36%
Selenium
28.5µg
10.7µg
32%
Folate
27µg
134µg
27%
Copper
0.03mg
0.227mg
22%
Vitamin B2
0.428mg
0.142mg
22%
Protein
22.87g
33.2g
21%
Cholesterol
99mg
48mg
17%
Choline
16.5mg
109.1mg
17%
Potassium
76mg
597mg
15%
Fats
33.31g
25.6g
12%
Vitamin B1
0.029mg
0.154mg
10%
Vitamin B3
0.059mg
1.732mg
10%
Vitamin B6
0.066mg
0.179mg
9%
Fiber
0g
1.8g
7%
Phosphorus
455mg
407mg
7%
Magnesium
27mg
51mg
6%
Vitamin B5
0.41mg
0.163mg
5%
Vitamin B12
1.1µg
0.99µg
5%
Monounsaturated fat
9.246g
11.305g
5%
Manganese
0.027mg
0.111mg
4%
Carbs
3.09g
11g
3%
Polyunsaturated fat
1.421g
1.011g
3%
Vitamin D*
24 IU
11 IU
2%
Vitamin D
0.6µg
0.3µg
2%
Vitamin E
0.71mg
0.49mg
1%
Calories
404kcal
410kcal
0%
Protein per 100 calories
5.7g
8.1g
N/A
Calories per 10 g protein
177kcal
123kcal
N/A
Weight per 100 calories
25g
24g
N/A
Unsaturated / Saturated Fat ratio
0.57
1.1
N/A
Net carbs
3.09g
9.2g
N/A
Sugar
0.48g
9g
N/A
Vitamin K
2.4µg
2.3µg
0%
Trans fat
0.917g
N/A
Tryptophan
0.547mg
0%
Threonine
1.044mg
0%
Isoleucine
1.206mg
0%
Leucine
1.939mg
0%
Lysine
1.025mg
0%
Methionine
0.547mg
0%
Phenylalanine
1.074mg
0%
Valine
1.404mg
0%
Histidine
0.547mg
0%
Omega-3 - EPA
0.01g
0g
N/A
Omega-3 - DHA
0.001g
0g
N/A
Omega-3 - DPA
0.017g
0g
N/A
Omega-6 - Eicosadienoic acid
0.007g
N/A
Macronutrient Comparison
Macronutrient breakdown side-by-side comparison
2
23%
33%
3%
37%
4%
Protein:
22.87 g
Fats:
33.31 g
Carbs:
3.09 g
Water:
37.02 g
Other:
3.71 g
3
33%
26%
11%
23%
7%
Protein:
33.2 g
Fats:
25.6 g
Carbs:
11 g
Water:
23.36 g
Other:
6.84 g
Contains
more
Fats Fats
+30.1%
Contains
more
Water Water
+58.5%
Contains
more
Protein Protein
+45.2%
Contains
more
Carbs Carbs
+256%
Contains
more
Other Other
+84.4%
Fat Type Comparison
Fat type breakdown side-by-side comparison
1
64%
31%
5%
Saturated fat:
Sat. Fat
18.867 g
Monounsaturated fat:
Mono. Fat
9.246 g
Polyunsaturated fat:
Poly. Fat
1.421 g
2
47%
49%
4%
Saturated fat:
Sat. Fat
10.85 g
Monounsaturated fat:
Mono. Fat
11.305 g
Polyunsaturated fat:
Poly. Fat
1.011 g
Contains
more
Poly. Fat Polyunsaturated fat
+40.6%
Contains
less
Sat. Fat Saturated fat
-42.5%
Contains
more
Mono. Fat Monounsaturated fat
+22.3%