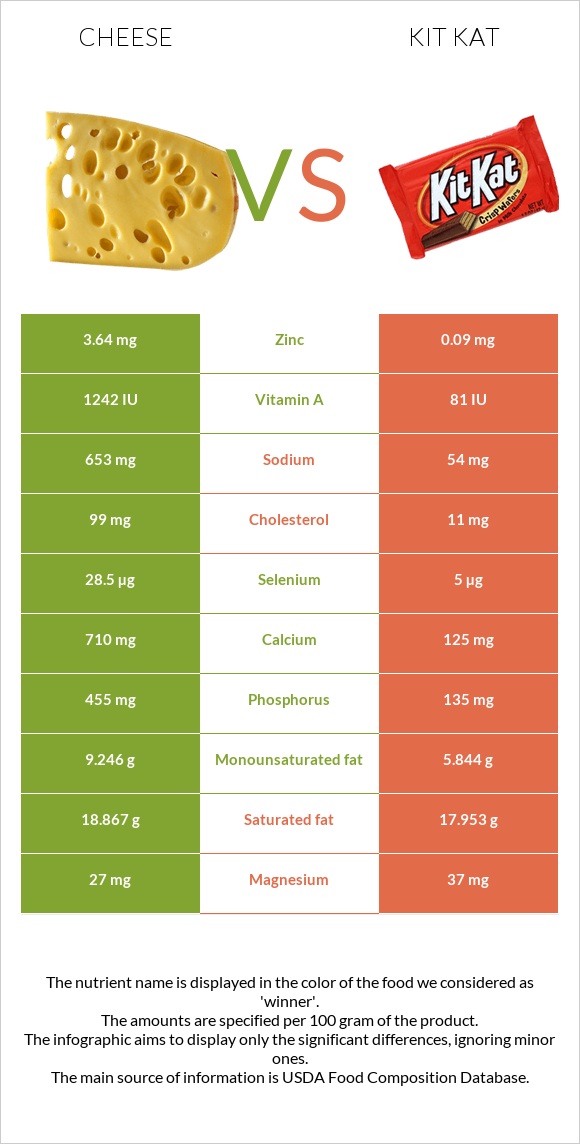
How are cheese and kit Kat different? Cheese has more calcium, phosphorus, selenium, zinc, vitamin A, vitamin B12, and vitamin B2; however, kit Kat is richer in copper. Cheese covers your daily need for calcium, 59% more than kit Kat. Cheese has 40 times more zinc than kit Kat. Cheese has 3.64mg of zinc, while kit Kat has 0.09mg. Kit Kat contains less sodium. Kit Kat has a higher glycemic index. The glycemic index of kit Kat is 50, while the glycemic index of cheese is 0. Cheese, cheddar and Candies, KIT KAT Wafer Bar types were used in this article.
Infographic
Mineral Comparison
Mineral comparison score is based on the number of minerals by which one or the other food is richer. The "coverage" charts below show how much of the daily needs can be covered by 300 grams of the food.
4
100 g
300 g
1 cubic inch - 17g 1 slice (1 oz) - 28g 1 oz - 28.35g 1 cup, shredded - 113g 1 cup, diced - 132g 1 cup, melted - 244g
Magnesium
Magnesium
Calcium
Calcium
Potassium
Potassium
Iron
Iron
Copper
Copper
Zinc
Zinc
Phosphorus
Phosphorus
Sodium
Sodium
Manganese
Manganese
Selenium
Selenium
19%
213%
6.7%
5.3%
10%
99%
195%
85%
3.5%
155%
6
100 g
300 g
1 bar, miniature (.35 oz) - 10g 1 bar (1.5 oz) - 42g 1 bar (1.625 oz) - 46g 1 bar (2.8 oz) - 78g 1 bar (3.375 oz) - 96g
Magnesium
Magnesium
Calcium
Calcium
Potassium
Potassium
Iron
Iron
Copper
Copper
Zinc
Zinc
Phosphorus
Phosphorus
Sodium
Sodium
Manganese
Manganese
Selenium
Selenium
26%
38%
20%
38%
73%
2.5%
58%
7%
13%
27%
Vitamin Comparison
Vitamin comparison score is based on the number of vitamins by which one or the other food is richer. The "coverage" charts below show how much of the daily needs can be covered by 300 grams of the food.
7
100 g
300 g
1 cubic inch - 17g 1 slice (1 oz) - 28g 1 oz - 28.35g 1 cup, shredded - 113g 1 cup, diced - 132g 1 cup, melted - 244g
Vitamin C
Vit. C
Vitamin D
Vit. D
Vitamin A
Vit. A
Vitamin E
Vit. E
Vitamin B1
Vit. B1
Vitamin B2
Vit. B2
Vitamin B3
Vit. B3
Vitamin B5
Vit. B5
Vitamin B6
Vit. B6
Vitamin B12
Vit. B12
Vitamin K
Vit. K
Folate
Folate
0%
9%
110%
14%
7.3%
99%
1.1%
25%
15%
138%
6%
20%
4
100 g
300 g
1 bar, miniature (.35 oz) - 10g 1 bar (1.5 oz) - 42g 1 bar (1.625 oz) - 46g 1 bar (2.8 oz) - 78g 1 bar (3.375 oz) - 96g
Vitamin C
Vit. C
Vitamin D
Vit. D
Vitamin A
Vit. A
Vitamin E
Vit. E
Vitamin B1
Vit. B1
Vitamin B2
Vit. B2
Vitamin B3
Vit. B3
Vitamin B5
Vit. B5
Vitamin B6
Vit. B6
Vitamin B12
Vit. B12
Vitamin K
Vit. K
Folate
Folate
0%
0%
8%
6.8%
29%
48%
9.4%
38%
4.6%
70%
13%
11%
All nutrients comparison - raw data values
Nutrient
DV% diff.
Calcium
710mg
125mg
59%
Phosphorus
455mg
135mg
46%
Selenium
28.5µg
5µg
43%
Vitamin A
330µg
24µg
34%
Protein
22.87g
6.51g
33%
Zinc
3.64mg
0.09mg
32%
Cholesterol
99mg
11mg
29%
Sodium
653mg
54mg
26%
Vitamin B12
1.1µg
0.56µg
23%
Carbs
3.09g
64.59g
21%
Copper
0.03mg
0.22mg
21%
Vitamin B2
0.428mg
0.21mg
17%
Fats
33.31g
25.99g
11%
Iron
0.14mg
1mg
11%
Monounsaturated fat
9.246g
5.844g
9%
Vitamin B1
0.029mg
0.117mg
7%
Calories
404kcal
518kcal
6%
Potassium
76mg
231mg
5%
Vitamin B5
0.41mg
0.64mg
5%
Fiber
0g
1g
4%
Starch
10.6g
4%
Vitamin B6
0.066mg
0.02mg
4%
Saturated fat
18.867g
17.953g
4%
Polyunsaturated fat
1.421g
0.895g
4%
Caffeine
0mg
14mg
4%
Vitamin D*
24 IU
0 IU
3%
Vitamin D
0.6µg
0µg
3%
Manganese
0.027mg
0.1mg
3%
Vitamin B3
0.059mg
0.5mg
3%
Folate
27µg
14µg
3%
Choline
16.5mg
31mg
3%
Magnesium
27mg
37mg
2%
Vitamin E
0.71mg
0.34mg
2%
Vitamin K
2.4µg
5.2µg
2%
Protein per 100 calories
5.7g
1.3g
N/A
Calories per 10 g protein
177kcal
796kcal
N/A
Weight per 100 calories
25g
19g
N/A
Unsaturated / Saturated Fat ratio
0.57
0.38
N/A
Net carbs
3.09g
63.59g
N/A
Sugar
0.48g
48.68g
N/A
Trans fat
0.917g
0.099g
N/A
Tryptophan
0.547mg
0.09mg
0%
Threonine
1.044mg
0.19mg
0%
Isoleucine
1.206mg
0.28mg
0%
Leucine
1.939mg
0.52mg
0%
Lysine
1.025mg
0.28mg
0%
Methionine
0.547mg
0.16mg
0%
Phenylalanine
1.074mg
0.27mg
0%
Valine
1.404mg
0.36mg
0%
Histidine
0.547mg
0.11mg
0%
Fructose
0g
0.2g
0%
Omega-3 - EPA
0.01g
0g
N/A
Omega-3 - DHA
0.001g
0g
N/A
Omega-3 - ALA
0.075g
N/A
Omega-3 - DPA
0.017g
0g
N/A
Omega-6 - Eicosadienoic acid
0.007g
0g
N/A
Macronutrient Comparison
Macronutrient breakdown side-by-side comparison
4
23%
33%
3%
37%
4%
Protein:
22.87 g
Fats:
33.31 g
Carbs:
3.09 g
Water:
37.02 g
Other:
3.71 g
1
7%
26%
65%
Protein:
6.51 g
Fats:
25.99 g
Carbs:
64.59 g
Water:
1.63 g
Other:
1.28 g
Contains
more
Protein Protein
+251.3%
Contains
more
Fats Fats
+28.2%
Contains
more
Water Water
+2171.2%
Contains
more
Other Other
+189.8%
Contains
more
Carbs Carbs
+1990.3%
Fat Type Comparison
Fat type breakdown side-by-side comparison
2
64%
31%
5%
Saturated fat:
Sat. Fat
18.867 g
Monounsaturated fat:
Mono. Fat
9.246 g
Polyunsaturated fat:
Poly. Fat
1.421 g
1
73%
24%
4%
Saturated fat:
Sat. Fat
17.953 g
Monounsaturated fat:
Mono. Fat
5.844 g
Polyunsaturated fat:
Poly. Fat
0.895 g
Contains
more
Mono. Fat Monounsaturated fat
+58.2%
Contains
more
Poly. Fat Polyunsaturated fat
+58.8%
~equal in
Saturated fat
~17.953g
Carbohydrate type comparison
Carbohydrate type breakdown side-by-side comparison
2
54%
25%
21%
Starch:
0 g
Sucrose:
0 g
Glucose:
0.26 g
Fructose:
0 g
Lactose:
0.12 g
Maltose:
0 g
Galactose:
0.1 g
5
18%
68%
14%
Starch:
10.6 g
Sucrose:
40.04 g
Glucose:
0.16 g
Fructose:
0.2 g
Lactose:
8.21 g
Maltose:
0.07 g
Galactose:
0 g
Contains
more
Glucose Glucose
+62.5%
Contains
more
Galactose Galactose
+∞%
Contains
more
Starch Starch
+∞%
Contains
more
Sucrose Sucrose
+∞%
Contains
more
Fructose Fructose
+∞%
Contains
more
Lactose Lactose
+6741.7%
Contains
more
Maltose Maltose
+∞%