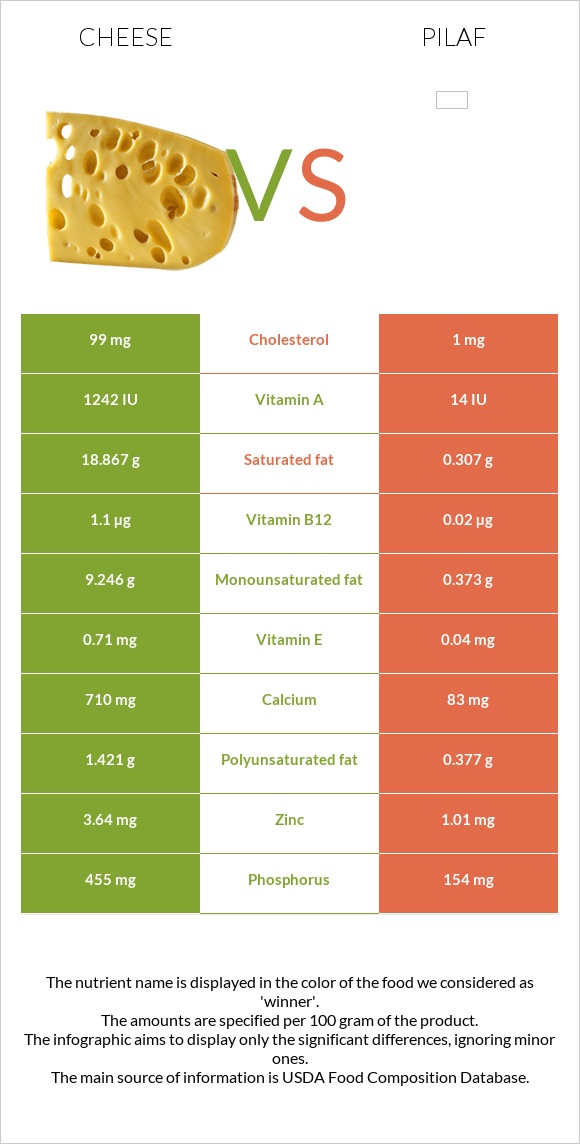
Differences between cheese and pilaf Cheese has more calcium, vitamin B12, and phosphorus, while pilaf has more vitamin B1, folate, vitamin B3, manganese, and iron. Cheese's daily need coverage for saturated fat is 93% higher. Pilaf contains 99 times less cholesterol than cheese. Cheese contains 99mg of cholesterol, while pilaf contains 1mg. Cheese has a lower glycemic index. The glycemic index of cheese is 0, while the glycemic index of pilaf is 60. The food types used in this comparison are Cheese, cheddar and Rice and vermicelli mix, rice pilaf flavor, unprepared .
Infographic
Mineral Comparison
Mineral comparison score is based on the number of minerals by which one or the other food is richer. The "coverage" charts below show how much of the daily needs can be covered by 300 grams of the food.
4
100 g
300 g
1 cubic inch - 17g 1 slice (1 oz) - 28g 1 oz - 28.35g 1 cup, shredded - 113g 1 cup, diced - 132g 1 cup, melted - 244g
Magnesium
Magnesium
Calcium
Calcium
Potassium
Potassium
Iron
Iron
Copper
Copper
Zinc
Zinc
Phosphorus
Phosphorus
Sodium
Sodium
Manganese
Manganese
Selenium
Selenium
19%
213%
6.7%
5.3%
10%
99%
195%
85%
3.5%
155%
6
100 g
300 g
1 tbsp - 9.6g 0.333 cup - 68g
Magnesium
Magnesium
Calcium
Calcium
Potassium
Potassium
Iron
Iron
Copper
Copper
Zinc
Zinc
Phosphorus
Phosphorus
Sodium
Sodium
Manganese
Manganese
Selenium
Selenium
23%
25%
17%
92%
55%
28%
66%
170%
115%
177%
Vitamin Comparison
Vitamin comparison score is based on the number of vitamins by which one or the other food is richer. The "coverage" charts below show how much of the daily needs can be covered by 300 grams of the food.
6
100 g
300 g
1 cubic inch - 17g 1 slice (1 oz) - 28g 1 oz - 28.35g 1 cup, shredded - 113g 1 cup, diced - 132g 1 cup, melted - 244g
Vitamin C
Vit. C
Vitamin D
Vit. D
Vitamin A
Vit. A
Vitamin E
Vit. E
Vitamin B1
Vit. B1
Vitamin B2
Vit. B2
Vitamin B3
Vit. B3
Vitamin B5
Vit. B5
Vitamin B6
Vit. B6
Vitamin B12
Vit. B12
Vitamin K
Vit. K
Folate
Folate
0%
9%
110%
14%
7.3%
99%
1.1%
25%
15%
138%
6%
20%
6
100 g
300 g
1 tbsp - 9.6g 0.333 cup - 68g
Vitamin C
Vit. C
Vitamin D
Vit. D
Vitamin A
Vit. A
Vitamin E
Vit. E
Vitamin B1
Vit. B1
Vitamin B2
Vit. B2
Vitamin B3
Vit. B3
Vitamin B5
Vit. B5
Vitamin B6
Vit. B6
Vitamin B12
Vit. B12
Vitamin K
Vit. K
Folate
Folate
14%
0%
1.3%
0.8%
151%
20%
115%
43%
92%
2.5%
1.3%
159%
All nutrients comparison - raw data values
Nutrient
DV% diff.
Saturated fat
18.867g
0.307g
84%
Calcium
710mg
83mg
63%
Fats
33.31g
1.37g
49%
Vitamin B1
0.029mg
0.603mg
48%
Folate
27µg
212µg
46%
Vitamin B12
1.1µg
0.02µg
45%
Phosphorus
455mg
154mg
43%
Vitamin B3
0.059mg
6.127mg
38%
Manganese
0.027mg
0.882mg
37%
Vitamin A
330µg
4µg
36%
Cholesterol
99mg
1mg
33%
Iron
0.14mg
2.44mg
29%
Starch
71.23g
29%
Sodium
653mg
1303mg
28%
Vitamin B2
0.428mg
0.087mg
26%
Vitamin B6
0.066mg
0.4mg
26%
Protein
22.87g
10.42g
25%
Carbs
3.09g
76.31g
24%
Zinc
3.64mg
1.01mg
24%
Monounsaturated fat
9.246g
0.373g
22%
Copper
0.03mg
0.166mg
15%
Selenium
28.5µg
32.4µg
7%
Polyunsaturated fat
1.421g
0.377g
7%
Vitamin B5
0.41mg
0.715mg
6%
Vitamin C
0mg
4.1mg
5%
Fiber
0g
1.2g
5%
Vitamin E
0.71mg
0.04mg
4%
Vitamin D*
24 IU
0 IU
3%
Vitamin D
0.6µg
0µg
3%
Potassium
76mg
188mg
3%
Calories
404kcal
359kcal
2%
Vitamin K
2.4µg
0.5µg
2%
Magnesium
27mg
32mg
1%
Protein per 100 calories
5.7g
2.9g
N/A
Calories per 10 g protein
177kcal
345kcal
N/A
Weight per 100 calories
25g
28g
N/A
Unsaturated / Saturated Fat ratio
0.57
2.4
N/A
Net carbs
3.09g
75.11g
N/A
Sugar
0.48g
1.53g
N/A
Trans fat
0.917g
0g
N/A
Choline
16.5mg
17.5mg
0%
Tryptophan
0.547mg
0.086mg
0%
Threonine
1.044mg
0.221mg
0%
Isoleucine
1.206mg
0.279mg
0%
Leucine
1.939mg
0.523mg
0%
Lysine
1.025mg
0.189mg
0%
Methionine
0.547mg
0.145mg
0%
Phenylalanine
1.074mg
0.32mg
0%
Valine
1.404mg
0.374mg
0%
Histidine
0.547mg
0.15mg
0%
Omega-3 - EPA
0.01g
0g
N/A
Omega-3 - DHA
0.001g
0g
N/A
Omega-3 - DPA
0.017g
0g
N/A
Omega-6 - Eicosadienoic acid
0.007g
0g
N/A
Macronutrient Comparison
Macronutrient breakdown side-by-side comparison
3
23%
33%
3%
37%
4%
Protein:
22.87 g
Fats:
33.31 g
Carbs:
3.09 g
Water:
37.02 g
Other:
3.71 g
2
10%
76%
8%
4%
Protein:
10.42 g
Fats:
1.37 g
Carbs:
76.31 g
Water:
8.04 g
Other:
3.86 g
Contains
more
Protein Protein
+119.5%
Contains
more
Fats Fats
+2331.4%
Contains
more
Water Water
+360.4%
Contains
more
Carbs Carbs
+2369.6%
Fat Type Comparison
Fat type breakdown side-by-side comparison
2
64%
31%
5%
Saturated fat:
Sat. Fat
18.867 g
Monounsaturated fat:
Mono. Fat
9.246 g
Polyunsaturated fat:
Poly. Fat
1.421 g
1
29%
35%
36%
Saturated fat:
Sat. Fat
0.307 g
Monounsaturated fat:
Mono. Fat
0.373 g
Polyunsaturated fat:
Poly. Fat
0.377 g
Contains
more
Mono. Fat Monounsaturated fat
+2378.8%
Contains
more
Poly. Fat Polyunsaturated fat
+276.9%
Contains
less
Sat. Fat Saturated fat
-98.4%
Carbohydrate type comparison
Carbohydrate type breakdown side-by-side comparison
3
54%
25%
21%
Starch:
0 g
Sucrose:
0 g
Glucose:
0.26 g
Fructose:
0 g
Lactose:
0.12 g
Maltose:
0 g
Galactose:
0.1 g
3
98%
Starch:
71.23 g
Sucrose:
0.3 g
Glucose:
0.1 g
Fructose:
0 g
Lactose:
0 g
Maltose:
1.13 g
Galactose:
0 g
Contains
more
Glucose Glucose
+160%
Contains
more
Lactose Lactose
+∞%
Contains
more
Galactose Galactose
+∞%
Contains
more
Starch Starch
+∞%
Contains
more
Sucrose Sucrose
+∞%
Contains
more
Maltose Maltose
+∞%