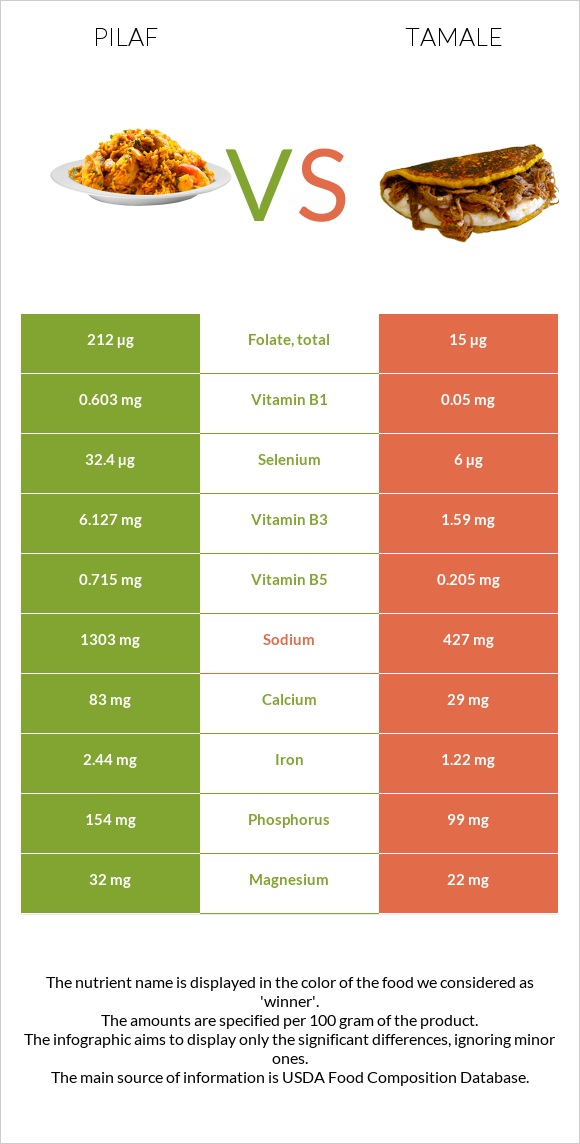
How are pilaf and tamale different? Pilaf is higher in folate, selenium, vitamin B1, manganese, vitamin B3, vitamin B6, iron, and copper; however, tamale is richer in vitamin B12. Daily need coverage for folate for pilaf is 49% higher. Pilaf contains 12 times more vitamin B1 than tamale. While pilaf contains 0.603mg of vitamin B1, tamale contains only 0.05mg. Tamale has less sodium. Pilaf has a lower glycemic index (60) than tamale (82). Rice and vermicelli mix, rice pilaf flavor, unprepared and Tamales (Navajo) are the varieties used in this article.
Infographic
Mineral Comparison
Mineral comparison score is based on the number of minerals by which one or the other food is richer. The "coverage" charts below show how much of the daily needs can be covered by 300 grams of the food.
8
100 g
300 g
1 tbsp - 9.6g 0.333 cup - 68g
Magnesium
Magnesium
Calcium
Calcium
Potassium
Potassium
Iron
Iron
Copper
Copper
Zinc
Zinc
Phosphorus
Phosphorus
Sodium
Sodium
Manganese
Manganese
Selenium
Selenium
23%
25%
17%
92%
55%
28%
66%
170%
115%
177%
2
100 g
300 g
1 piece - 186g
Magnesium
Magnesium
Calcium
Calcium
Potassium
Potassium
Iron
Iron
Copper
Copper
Zinc
Zinc
Phosphorus
Phosphorus
Sodium
Sodium
Manganese
Manganese
Selenium
Selenium
16%
8.7%
12%
46%
21%
40%
42%
56%
23%
33%
Vitamin Comparison
Vitamin comparison score is based on the number of vitamins by which one or the other food is richer. The "coverage" charts below show how much of the daily needs can be covered by 300 grams of the food.
9
100 g
300 g
1 tbsp - 9.6g 0.333 cup - 68g
Vitamin C
Vit. C
Vitamin D
Vit. D
Vitamin A
Vit. A
Vitamin E
Vit. E
Vitamin B1
Vit. B1
Vitamin B2
Vit. B2
Vitamin B3
Vit. B3
Vitamin B5
Vit. B5
Vitamin B6
Vit. B6
Vitamin B12
Vit. B12
Vitamin K
Vit. K
Folate
Folate
14%
0%
1.3%
0.8%
151%
20%
115%
43%
92%
2.5%
1.3%
159%
1
100 g
300 g
1 piece - 186g
Vitamin C
Vit. C
Vitamin D
Vit. D
Vitamin A
Vit. A
Vitamin E
Vit. E
Vitamin B1
Vit. B1
Vitamin B2
Vit. B2
Vitamin B3
Vit. B3
Vitamin B5
Vit. B5
Vitamin B6
Vit. B6
Vitamin B12
Vit. B12
Vitamin K
Vit. K
Folate
Folate
5.7%
0%
0%
0%
13%
18%
30%
12%
33%
68%
0%
11%
All nutrients comparison - raw data values
Nutrient
DV% diff.
Folate
212µg
15µg
49%
Selenium
32.4µg
6µg
48%
Vitamin B1
0.603mg
0.05mg
46%
Sodium
1303mg
427mg
38%
Manganese
0.882mg
0.174mg
31%
Vitamin B3
6.127mg
1.59mg
28%
Starch
71.23g
12.27g
24%
Vitamin B12
0.02µg
0.54µg
22%
Vitamin B6
0.4mg
0.143mg
20%
Carbs
76.31g
18.12g
19%
Iron
2.44mg
1.22mg
15%
Copper
0.166mg
0.063mg
11%
Calories
359kcal
153kcal
10%
Vitamin B5
0.715mg
0.205mg
10%
Saturated fat
0.307g
2.396g
9%
Protein
10.42g
6.28g
8%
Fiber
1.2g
3.1g
8%
Phosphorus
154mg
99mg
8%
Fats
1.37g
6.12g
7%
Monounsaturated fat
0.373g
2.739g
6%
Cholesterol
1mg
17mg
5%
Calcium
83mg
29mg
5%
Zinc
1.01mg
1.48mg
4%
Vitamin C
4.1mg
1.7mg
3%
Choline
17.5mg
3%
Magnesium
32mg
22mg
2%
Potassium
188mg
131mg
2%
Polyunsaturated fat
0.377g
0.688g
2%
Vitamin B2
0.087mg
0.08mg
1%
Protein per 100 calories
2.9g
4.1g
N/A
Calories per 10 g protein
345kcal
244kcal
N/A
Weight per 100 calories
28g
65g
N/A
Unsaturated / Saturated Fat ratio
2.4
1.4
N/A
Net carbs
75.11g
15.02g
N/A
Sugar
1.53g
0.99g
N/A
Vitamin A
4µg
0µg
0%
Vitamin E
0.04mg
0mg
0%
Vitamin K
0.5µg
0%
Tryptophan
0.086mg
0.052mg
0%
Threonine
0.221mg
0.239mg
0%
Isoleucine
0.279mg
0.271mg
0%
Leucine
0.523mg
0.568mg
0%
Lysine
0.189mg
0.427mg
0%
Methionine
0.145mg
0.15mg
0%
Phenylalanine
0.32mg
0.275mg
0%
Valine
0.374mg
0.318mg
0%
Histidine
0.15mg
0.196mg
0%
Fructose
0g
0.17g
0%
Omega-3 - ALA
0.029g
N/A
Macronutrient Comparison
Macronutrient breakdown side-by-side comparison
3
10%
76%
8%
4%
Protein:
10.42 g
Fats:
1.37 g
Carbs:
76.31 g
Water:
8.04 g
Other:
3.86 g
2
6%
6%
18%
68%
Protein:
6.28 g
Fats:
6.12 g
Carbs:
18.12 g
Water:
68.1 g
Other:
1.38 g
Contains
more
Protein Protein
+65.9%
Contains
more
Carbs Carbs
+321.1%
Contains
more
Other Other
+179.7%
Contains
more
Fats Fats
+346.7%
Contains
more
Water Water
+747%
Fat Type Comparison
Fat type breakdown side-by-side comparison
1
29%
35%
36%
Saturated fat:
Sat. Fat
0.307 g
Monounsaturated fat:
Mono. Fat
0.373 g
Polyunsaturated fat:
Poly. Fat
0.377 g
2
41%
47%
12%
Saturated fat:
Sat. Fat
2.396 g
Monounsaturated fat:
Mono. Fat
2.739 g
Polyunsaturated fat:
Poly. Fat
0.688 g
Contains
less
Sat. Fat Saturated fat
-87.2%
Contains
more
Mono. Fat Monounsaturated fat
+634.3%
Contains
more
Poly. Fat Polyunsaturated fat
+82.5%
Carbohydrate type comparison
Carbohydrate type breakdown side-by-side comparison
2
98%
Starch:
71.23 g
Sucrose:
0.3 g
Glucose:
0.1 g
Fructose:
0 g
Lactose:
0 g
Maltose:
1.13 g
Galactose:
0 g
3
92%
3%
Starch:
12.27 g
Sucrose:
0.4 g
Glucose:
0.21 g
Fructose:
0.17 g
Lactose:
0 g
Maltose:
0.22 g
Galactose:
0 g
Contains
more
Starch Starch
+480.5%
Contains
more
Maltose Maltose
+413.6%
Contains
more
Sucrose Sucrose
+33.3%
Contains
more
Glucose Glucose
+110%
Contains
more
Fructose Fructose
+∞%
~equal in
Lactose
~0g
~equal in
Galactose
~0g